29
/
en
AIzaSyAYiBZKx7MnpbEhh9jyipgxe19OcubqV5w
April 1, 2024
182374
Luxembourg
LUX
true
2
1
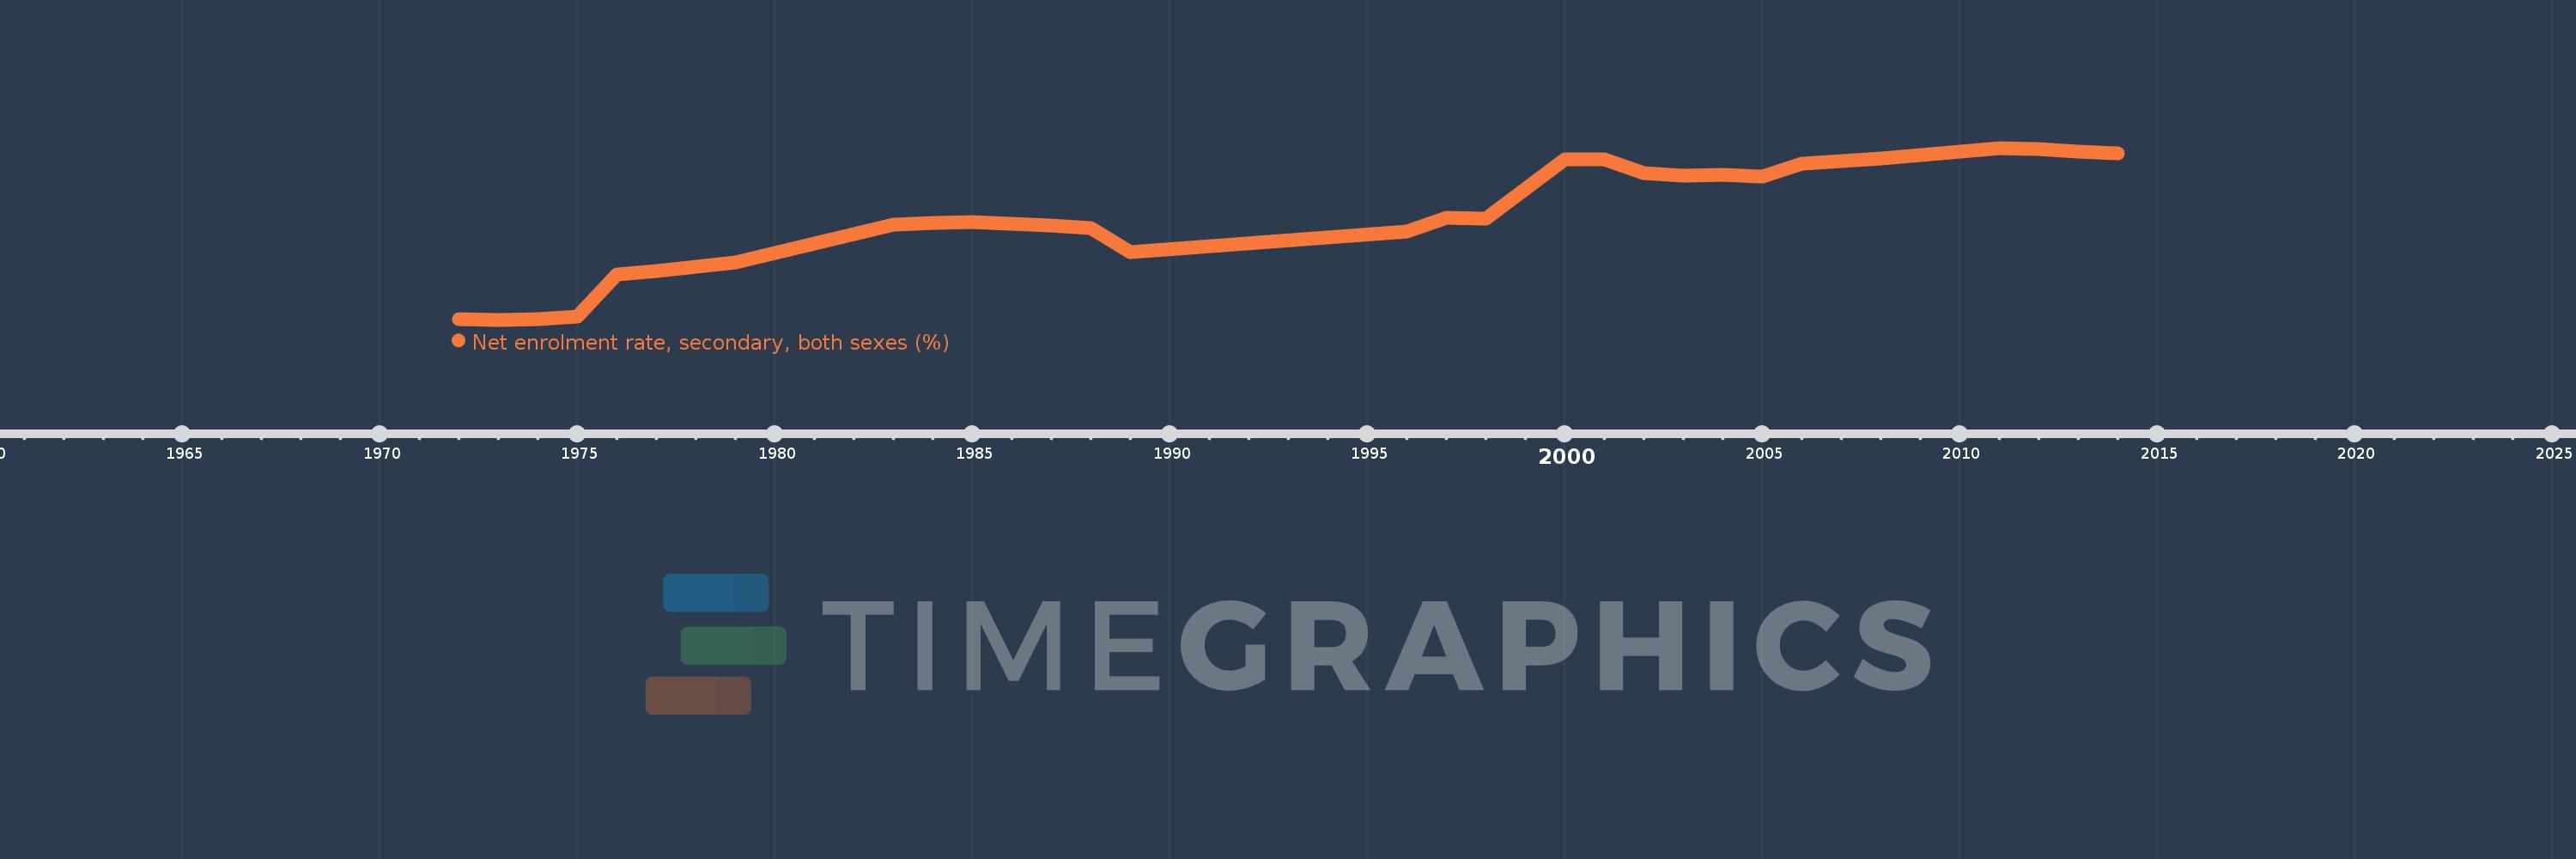
Net enrolment rate, secondary, both sexes (%)
2014,2013,2012,2011,2009,2008,2007,2006,2005,2004,2003,2002,2001,2000,1998,1997,1996,1989,1988,1987,1985,1984,1983,1979,1978,1977,1976,1975,1974,1973,1972
This statistics in other country:
AfghanistanAlbaniaAlgeriaAngolaAntigua and BarbudaArab WorldArgentinaArmeniaArubaAustraliaAustriaAzerbaijanBahamas, TheBahrainBangladeshBarbadosBelarusBelgiumBelizeBeninBermudaBhutanBoliviaBotswanaBrazilBritish Virgin IslandsBrunei DarussalamBulgariaBurkina FasoBurundiCabo VerdeCambodiaCameroonCanadaCaribbean small statesCentral African RepublicCentral Europe and the BalticsChadChileColombiaComorosCongo, Dem. Rep.Congo, Rep.Costa RicaCroatiaCubaCyprusDenmarkDjiboutiDominicaDominican RepublicEarly-demographic dividendEast Asia & PacificEast Asia & Pacific (excluding high income)East Asia & Pacific (IDA & IBRD countries)EcuadorEgypt, Arab Rep.El SalvadorEquatorial GuineaEritreaEstoniaEthiopiaEuro areaEurope & Central AsiaEurope & Central Asia (excluding high income)Europe & Central Asia (IDA & IBRD countries)European UnionFijiFinlandFragile and conflict affected situationsFranceGambia, TheGeorgiaGhanaGreeceGrenadaGuatemalaGuineaGuinea-BissauGuyanaHeavily indebted poor countries (HIPC)High incomeHondurasHong Kong SAR, ChinaHungaryIBRD onlyIcelandIDA & IBRD totalIDA blendIDA onlyIDA totalIndiaIndonesiaIran, Islamic Rep.IraqIrelandIsraelItalyJamaicaJapanJordanKazakhstanKenyaKiribatiKorea, Dem. People’s Rep.Korea, Rep.KuwaitKyrgyz RepublicLao PDRLate-demographic dividendLatin America & Caribbean Latin America & Caribbean (excluding high income)Latin America & the Caribbean (IDA & IBRD countries)LatviaLeast developed countries: UN classificationLebanonLesothoLibyaLiechtensteinLithuaniaLow & middle incomeLow incomeLower middle incomeLuxembourgMacao SAR, ChinaMacedonia, FYRMadagascarMalawiMalaysiaMaldivesMaliMaltaMarshall IslandsMauritaniaMauritiusMexicoMiddle East & North AfricaMiddle East & North Africa (excluding high income)Middle East & North Africa (IDA & IBRD countries)Middle incomeMoldovaMongoliaMoroccoMozambiqueMyanmarNamibiaNauruNepalNetherlandsNew ZealandNicaraguaNigerNorth AmericaNorwayOECD membersOmanOther small statesPacific island small statesPakistanPanamaParaguayPeruPhilippinesPolandPortugalPost-demographic dividendPre-demographic dividendPuerto RicoQatarRomaniaSamoaSao Tome and PrincipeSaudi ArabiaSenegalSerbiaSeychellesSierra LeoneSloveniaSmall statesSolomon IslandsSomaliaSouth AfricaSouth AsiaSouth Asia (IDA & IBRD)SpainSri LankaSt. Kitts and NevisSt. LuciaSt. Vincent and the GrenadinesSub-Saharan Africa Sub-Saharan Africa (excluding high income)Sub-Saharan Africa (IDA & IBRD countries)SurinameSwazilandSwedenSwitzerlandSyrian Arab RepublicTajikistanThailandTimor-LesteTogoTongaTrinidad and TobagoTunisiaTurkeyTuvaluUgandaUkraineUnited Arab EmiratesUnited KingdomUnited StatesUpper middle incomeUruguayVanuatuVenezuela, RBVietnamWest Bank and GazaWorldYemen, Rep.Zimbabwe Timeline:
This timeline shows a graph from 1972 to 2014 of Luxembourg. No data until 1971. Number of actual observations by date: 31.
Source name:
World Development Indicators
Source organization:
UNESCO Institute for Statistics
Categories, topics:
Education
Last updated:
apr 23, 2017
Indicators value changes by year
Minimum:
44.194
jan 1, 1973
Maximum:
86.819
jan 1, 2011
At the date of observation
Value
Absolute change
Change from previous value
jan 1, 1972
44.261
+44.261
0.0%
jan 1, 1973
44.194
-0.067
-0.15%
jan 1, 1974
44.375
+0.181
0.41%
jan 1, 1975
44.901
+0.526
1.19%
jan 1, 1976
55.42
+10.519
23.43%
jan 1, 1977
56.315
+0.895
1.62%
jan 1, 1978
57.354
+1.039
1.84%
jan 1, 1979
58.509
+1.155
2.01%
jan 1, 1983
67.684
+9.175
15.68%
jan 1, 1984
68.134
+0.45
0.67%
jan 1, 1985
68.387
+0.253
0.37%
jan 1, 1987
67.486
-0.901
-1.32%
jan 1, 1988
66.989
-0.497
-0.74%
jan 1, 1989
60.969
-6.021
-8.99%
jan 1, 1996
65.99
+5.022
8.24%
jan 1, 1997
69.403
+3.412
5.17%
jan 1, 1998
69.35
-0.053
-0.08%
jan 1, 2000
83.963
+14.613
21.07%
jan 1, 2001
83.936
-0.027
-0.03%
jan 1, 2002
80.664
-3.272
-3.9%
jan 1, 2003
79.985
-0.679
-0.84%
jan 1, 2004
80.099
+0.114
0.14%
jan 1, 2005
79.717
-0.382
-0.48%
jan 1, 2006
82.973
+3.256
4.08%
jan 1, 2007
83.5
+0.527
0.64%
jan 1, 2008
84.148
+0.648
0.78%
jan 1, 2009
85.024
+0.875
1.04%
jan 1, 2011
86.819
+1.796
2.11%
jan 1, 2012
86.468
-0.352
-0.41%
jan 1, 2013
85.808
-0.66
-0.76%
jan 1, 2014
85.442
-0.366
-0.43%
Ranking of countries by current statistics by years


Comments: