29
/
en
AIzaSyAYiBZKx7MnpbEhh9jyipgxe19OcubqV5w
April 1, 2024
116079
Cuba
CUB
true
2
1
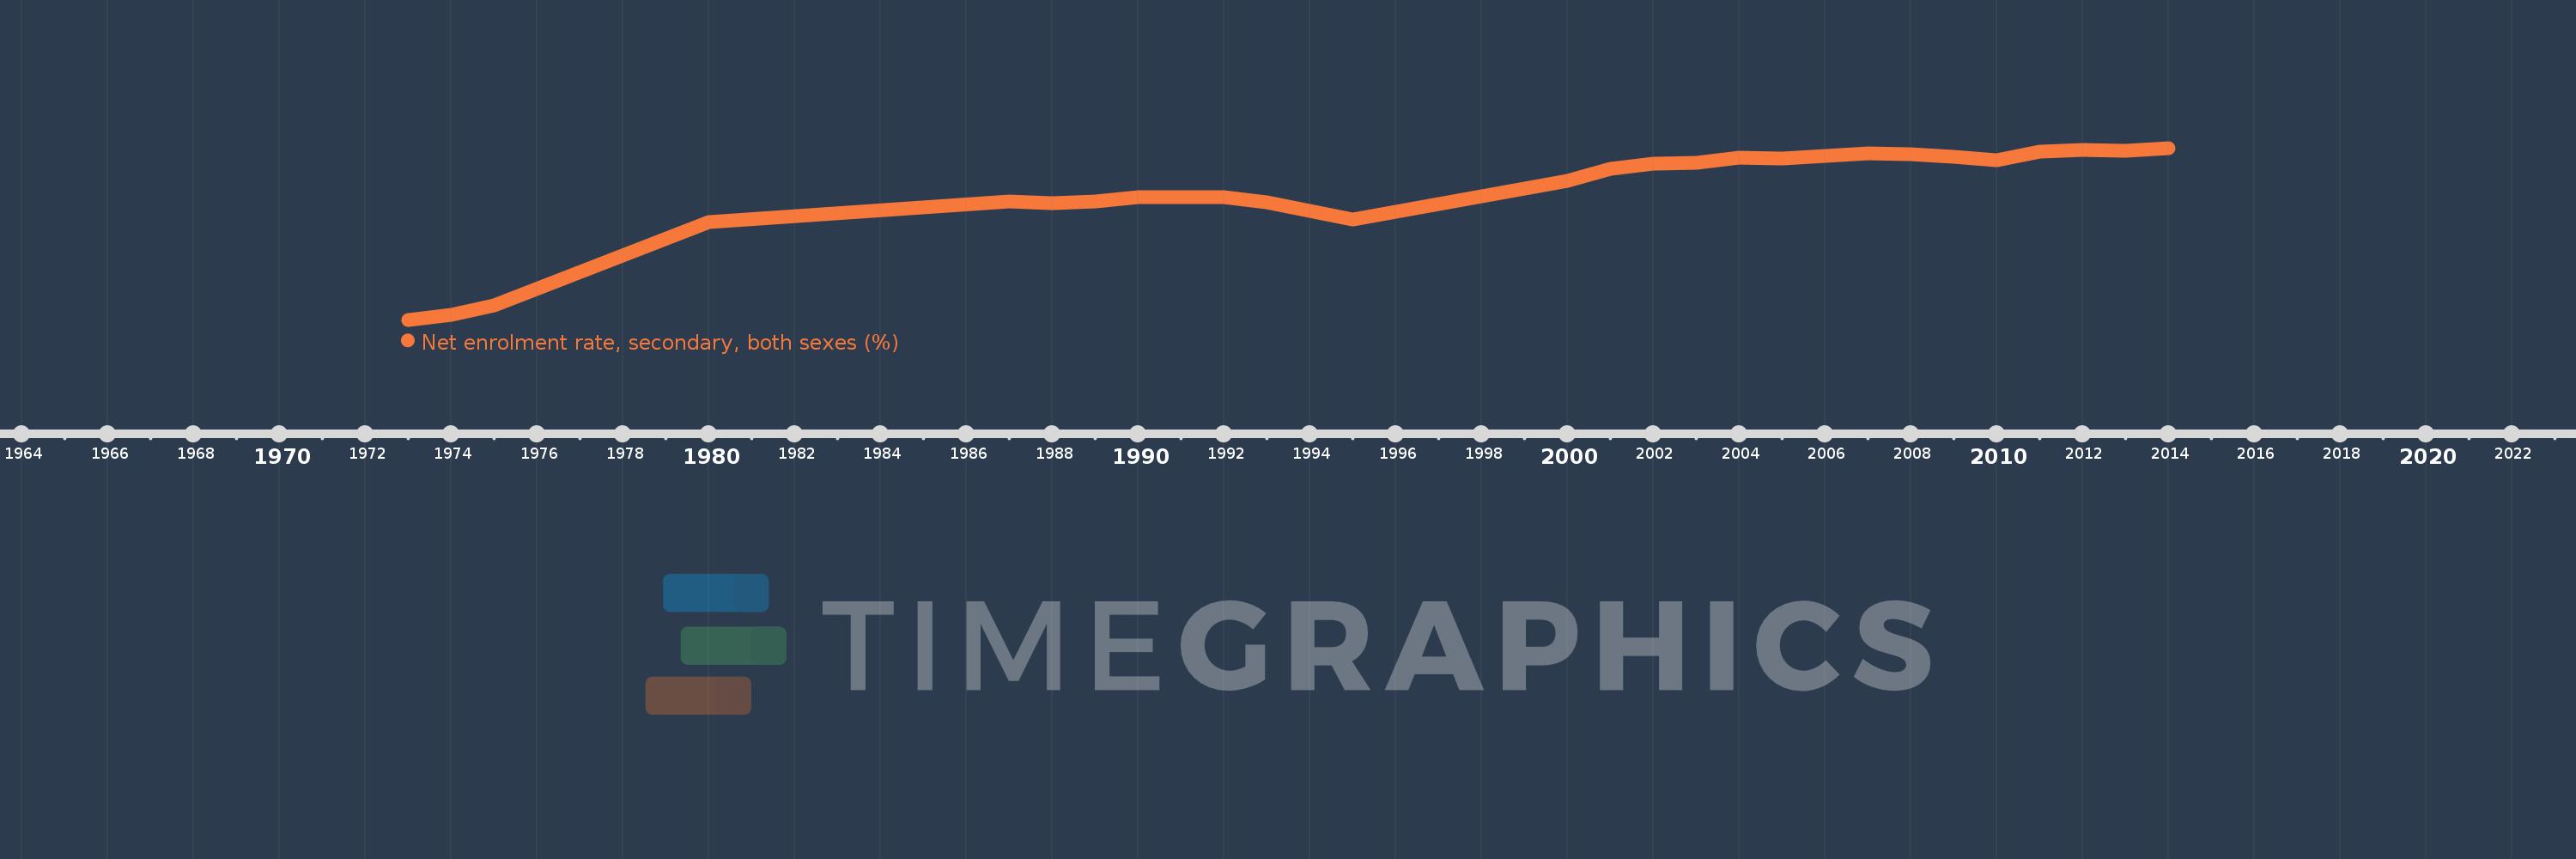
Net enrolment rate, secondary, both sexes (%)
2014,2013,2012,2011,2010,2009,2008,2007,2006,2005,2004,2003,2002,2001,2000,1995,1993,1992,1991,1990,1989,1988,1987,1980,1975,1974,1973
This statistics in other country:
AfghanistanAlbaniaAlgeriaAngolaAntigua and BarbudaArab WorldArgentinaArmeniaArubaAustraliaAustriaAzerbaijanBahamas, TheBahrainBangladeshBarbadosBelarusBelgiumBelizeBeninBermudaBhutanBoliviaBotswanaBrazilBritish Virgin IslandsBrunei DarussalamBulgariaBurkina FasoBurundiCabo VerdeCambodiaCameroonCanadaCaribbean small statesCentral African RepublicCentral Europe and the BalticsChadChileColombiaComorosCongo, Dem. Rep.Congo, Rep.Costa RicaCroatiaCubaCyprusDenmarkDjiboutiDominicaDominican RepublicEarly-demographic dividendEast Asia & PacificEast Asia & Pacific (excluding high income)East Asia & Pacific (IDA & IBRD countries)EcuadorEgypt, Arab Rep.El SalvadorEquatorial GuineaEritreaEstoniaEthiopiaEuro areaEurope & Central AsiaEurope & Central Asia (excluding high income)Europe & Central Asia (IDA & IBRD countries)European UnionFijiFinlandFragile and conflict affected situationsFranceGambia, TheGeorgiaGhanaGreeceGrenadaGuatemalaGuineaGuinea-BissauGuyanaHeavily indebted poor countries (HIPC)High incomeHondurasHong Kong SAR, ChinaHungaryIBRD onlyIcelandIDA & IBRD totalIDA blendIDA onlyIDA totalIndiaIndonesiaIran, Islamic Rep.IraqIrelandIsraelItalyJamaicaJapanJordanKazakhstanKenyaKiribatiKorea, Dem. People’s Rep.Korea, Rep.KuwaitKyrgyz RepublicLao PDRLate-demographic dividendLatin America & Caribbean Latin America & Caribbean (excluding high income)Latin America & the Caribbean (IDA & IBRD countries)LatviaLeast developed countries: UN classificationLebanonLesothoLibyaLiechtensteinLithuaniaLow & middle incomeLow incomeLower middle incomeLuxembourgMacao SAR, ChinaMacedonia, FYRMadagascarMalawiMalaysiaMaldivesMaliMaltaMarshall IslandsMauritaniaMauritiusMexicoMiddle East & North AfricaMiddle East & North Africa (excluding high income)Middle East & North Africa (IDA & IBRD countries)Middle incomeMoldovaMongoliaMoroccoMozambiqueMyanmarNamibiaNauruNepalNetherlandsNew ZealandNicaraguaNigerNorth AmericaNorwayOECD membersOmanOther small statesPacific island small statesPakistanPanamaParaguayPeruPhilippinesPolandPortugalPost-demographic dividendPre-demographic dividendPuerto RicoQatarRomaniaSamoaSao Tome and PrincipeSaudi ArabiaSenegalSerbiaSeychellesSierra LeoneSloveniaSmall statesSolomon IslandsSomaliaSouth AfricaSouth AsiaSouth Asia (IDA & IBRD)SpainSri LankaSt. Kitts and NevisSt. LuciaSt. Vincent and the GrenadinesSub-Saharan Africa Sub-Saharan Africa (excluding high income)Sub-Saharan Africa (IDA & IBRD countries)SurinameSwazilandSwedenSwitzerlandSyrian Arab RepublicTajikistanThailandTimor-LesteTogoTongaTrinidad and TobagoTunisiaTurkeyTuvaluUgandaUkraineUnited Arab EmiratesUnited KingdomUnited StatesUpper middle incomeUruguayVanuatuVenezuela, RBVietnamWest Bank and GazaWorldYemen, Rep.Zimbabwe Timeline:
This timeline shows a graph from 1973 to 2014 of Cuba. No data until 1972. Number of actual observations by date: 27.
Source name:
World Development Indicators
Source organization:
UNESCO Institute for Statistics
Categories, topics:
Education
Last updated:
apr 23, 2017
Indicators value changes by year
Minimum:
19.841
jan 1, 1973
Maximum:
89.462
jan 1, 2014
At the date of observation
Value
Absolute change
Change from previous value
jan 1, 1973
19.841
+19.841
0.0%
jan 1, 1974
21.798
+1.957
9.86%
jan 1, 1975
25.828
+4.03
18.49%
jan 1, 1980
59.287
+33.459
129.54%
jan 1, 1987
67.669
+8.382
14.14%
jan 1, 1988
67.195
-0.475
-0.7%
jan 1, 1989
67.935
+0.741
1.1%
jan 1, 1990
69.385
+1.45
2.13%
jan 1, 1991
69.455
+0.07
0.1%
jan 1, 1992
69.42
-0.035
-0.05%
jan 1, 1993
67.414
-2.006
-2.89%
jan 1, 1995
60.41
-7.004
-10.39%
jan 1, 2000
76.288
+15.878
26.28%
jan 1, 2001
81.13
+4.842
6.35%
jan 1, 2002
83.04
+1.91
2.35%
jan 1, 2003
83.337
+0.297
0.36%
jan 1, 2004
85.687
+2.35
2.82%
jan 1, 2005
85.334
-0.353
-0.41%
jan 1, 2006
86.265
+0.931
1.09%
jan 1, 2007
87.377
+1.111
1.29%
jan 1, 2008
86.81
-0.566
-0.65%
jan 1, 2009
86.012
-0.798
-0.92%
jan 1, 2010
84.572
-1.441
-1.68%
jan 1, 2011
87.897
+3.326
3.93%
jan 1, 2012
88.784
+0.887
1.01%
jan 1, 2013
88.32
-0.464
-0.52%
jan 1, 2014
89.462
+1.142
1.29%
Ranking of countries by current statistics by years


Comments: