29
/
en
AIzaSyAYiBZKx7MnpbEhh9jyipgxe19OcubqV5w
April 1, 2024
170271
Korea, Rep.
KOR
true
2
1
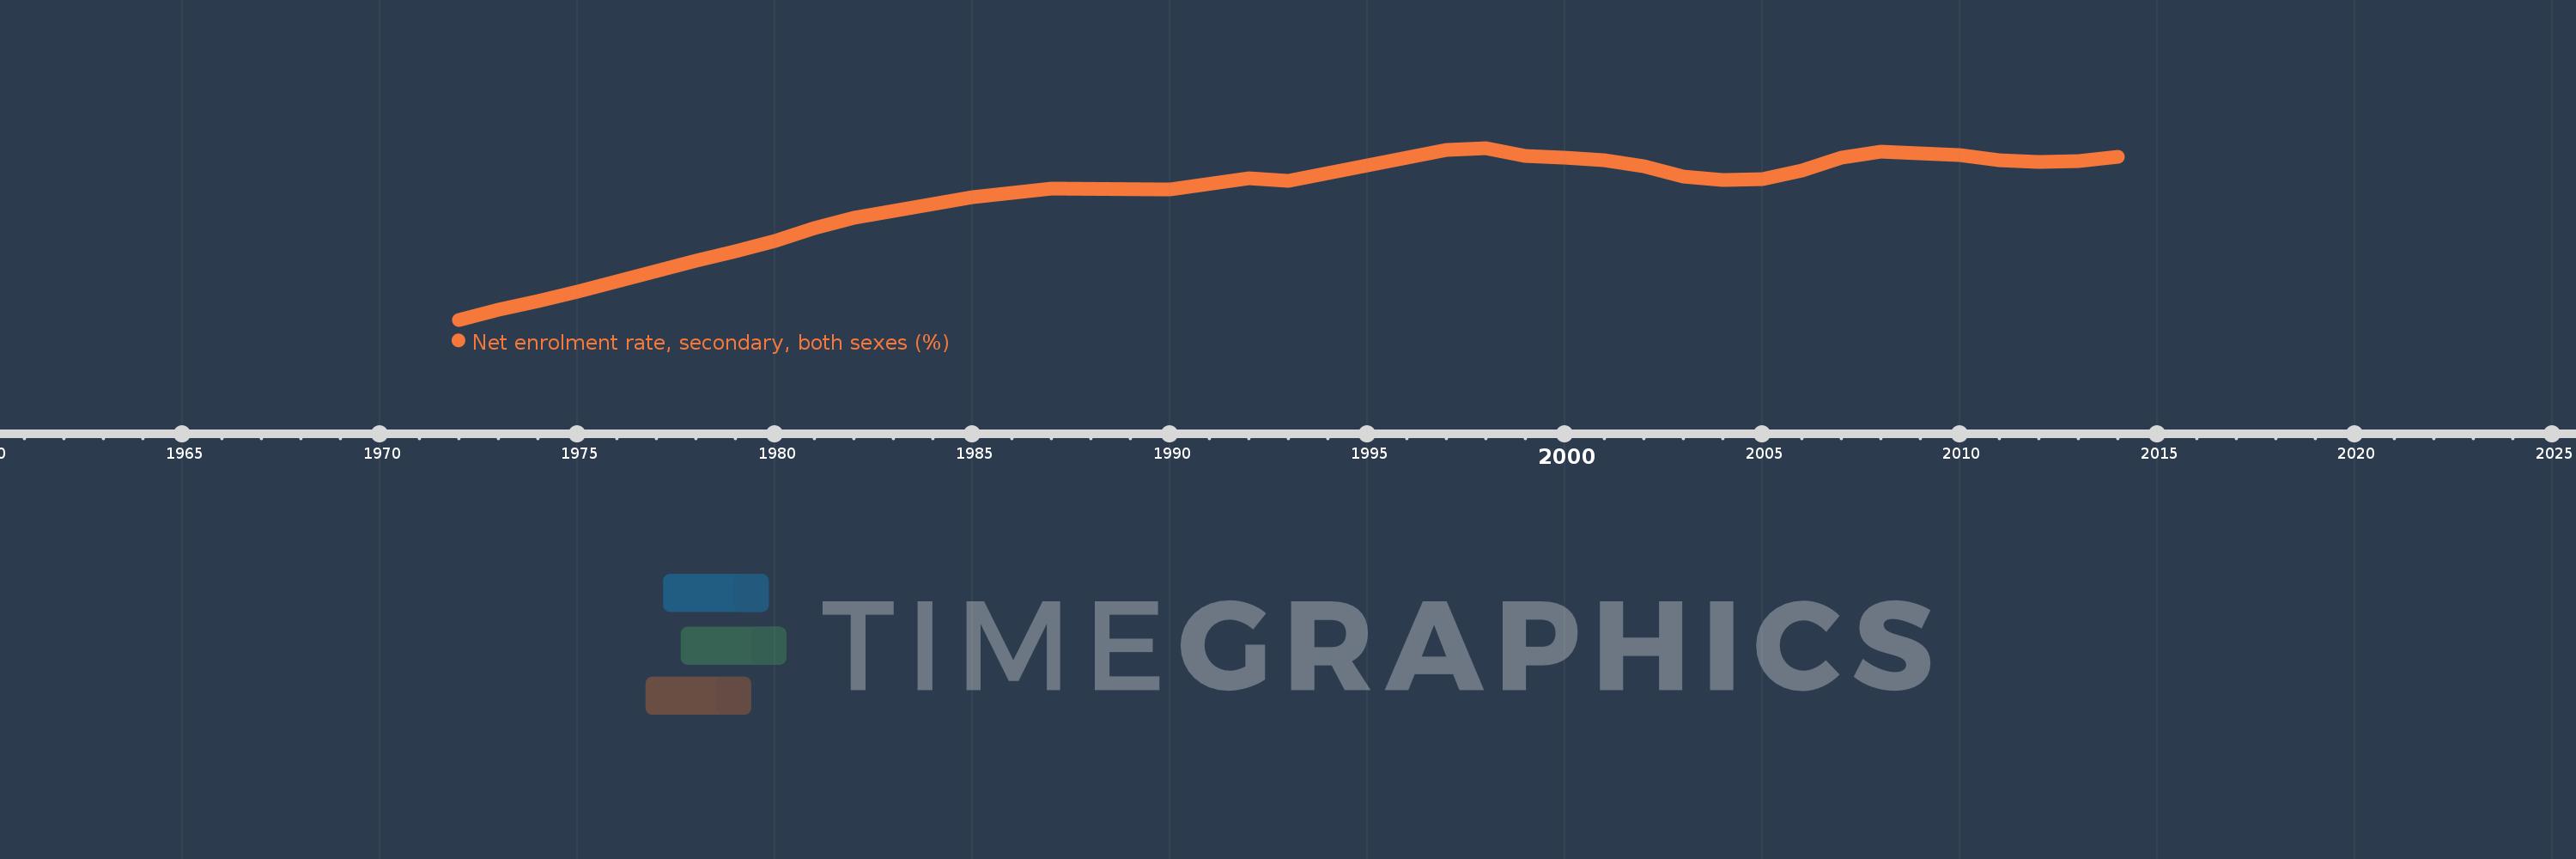
Net enrolment rate, secondary, both sexes (%)
2014,2013,2012,2011,2010,2009,2008,2007,2006,2005,2004,2003,2002,2001,2000,1999,1998,1997,1993,1992,1990,1987,1986,1985,1982,1981,1980,1979,1978,1977,1976,1975,1974,1973,1972
This statistics in other country:
AfghanistanAlbaniaAlgeriaAngolaAntigua and BarbudaArab WorldArgentinaArmeniaArubaAustraliaAustriaAzerbaijanBahamas, TheBahrainBangladeshBarbadosBelarusBelgiumBelizeBeninBermudaBhutanBoliviaBotswanaBrazilBritish Virgin IslandsBrunei DarussalamBulgariaBurkina FasoBurundiCabo VerdeCambodiaCameroonCanadaCaribbean small statesCentral African RepublicCentral Europe and the BalticsChadChileColombiaComorosCongo, Dem. Rep.Congo, Rep.Costa RicaCroatiaCubaCyprusDenmarkDjiboutiDominicaDominican RepublicEarly-demographic dividendEast Asia & PacificEast Asia & Pacific (excluding high income)East Asia & Pacific (IDA & IBRD countries)EcuadorEgypt, Arab Rep.El SalvadorEquatorial GuineaEritreaEstoniaEthiopiaEuro areaEurope & Central AsiaEurope & Central Asia (excluding high income)Europe & Central Asia (IDA & IBRD countries)European UnionFijiFinlandFragile and conflict affected situationsFranceGambia, TheGeorgiaGhanaGreeceGrenadaGuatemalaGuineaGuinea-BissauGuyanaHeavily indebted poor countries (HIPC)High incomeHondurasHong Kong SAR, ChinaHungaryIBRD onlyIcelandIDA & IBRD totalIDA blendIDA onlyIDA totalIndiaIndonesiaIran, Islamic Rep.IraqIrelandIsraelItalyJamaicaJapanJordanKazakhstanKenyaKiribatiKorea, Dem. People’s Rep.Korea, Rep.KuwaitKyrgyz RepublicLao PDRLate-demographic dividendLatin America & Caribbean Latin America & Caribbean (excluding high income)Latin America & the Caribbean (IDA & IBRD countries)LatviaLeast developed countries: UN classificationLebanonLesothoLibyaLiechtensteinLithuaniaLow & middle incomeLow incomeLower middle incomeLuxembourgMacao SAR, ChinaMacedonia, FYRMadagascarMalawiMalaysiaMaldivesMaliMaltaMarshall IslandsMauritaniaMauritiusMexicoMiddle East & North AfricaMiddle East & North Africa (excluding high income)Middle East & North Africa (IDA & IBRD countries)Middle incomeMoldovaMongoliaMoroccoMozambiqueMyanmarNamibiaNauruNepalNetherlandsNew ZealandNicaraguaNigerNorth AmericaNorwayOECD membersOmanOther small statesPacific island small statesPakistanPanamaParaguayPeruPhilippinesPolandPortugalPost-demographic dividendPre-demographic dividendPuerto RicoQatarRomaniaSamoaSao Tome and PrincipeSaudi ArabiaSenegalSerbiaSeychellesSierra LeoneSloveniaSmall statesSolomon IslandsSomaliaSouth AfricaSouth AsiaSouth Asia (IDA & IBRD)SpainSri LankaSt. Kitts and NevisSt. LuciaSt. Vincent and the GrenadinesSub-Saharan Africa Sub-Saharan Africa (excluding high income)Sub-Saharan Africa (IDA & IBRD countries)SurinameSwazilandSwedenSwitzerlandSyrian Arab RepublicTajikistanThailandTimor-LesteTogoTongaTrinidad and TobagoTunisiaTurkeyTuvaluUgandaUkraineUnited Arab EmiratesUnited KingdomUnited StatesUpper middle incomeUruguayVanuatuVenezuela, RBVietnamWest Bank and GazaWorldYemen, Rep.Zimbabwe Timeline:
This timeline shows a graph from 1972 to 2014 of Korea, Rep.. No data until 1971. Number of actual observations by date: 35.
Source name:
World Development Indicators
Source organization:
UNESCO Institute for Statistics
Categories, topics:
Education
Last updated:
apr 23, 2017
Indicators value changes by year
Minimum:
35.978
jan 1, 1972
Maximum:
99.448
jan 1, 1998
At the date of observation
Value
Absolute change
Change from previous value
jan 1, 1972
35.978
+35.978
0.0%
jan 1, 1973
39.734
+3.756
10.44%
jan 1, 1974
42.718
+2.984
7.51%
jan 1, 1975
46.305
+3.587
8.4%
jan 1, 1976
50.099
+3.794
8.19%
jan 1, 1977
53.974
+3.875
7.73%
jan 1, 1978
57.759
+3.786
7.01%
jan 1, 1979
61.157
+3.398
5.88%
jan 1, 1980
64.924
+3.767
6.16%
jan 1, 1981
69.693
+4.769
7.35%
jan 1, 1982
73.611
+3.918
5.62%
jan 1, 1985
81.209
+7.598
10.32%
jan 1, 1986
82.824
+1.615
1.99%
jan 1, 1987
84.56
+1.736
2.1%
jan 1, 1990
84.174
-0.386
-0.46%
jan 1, 1992
88.168
+3.994
4.75%
jan 1, 1993
87.419
-0.749
-0.85%
jan 1, 1997
98.622
+11.203
12.82%
jan 1, 1998
99.448
+0.827
0.84%
jan 1, 1999
96.638
-2.811
-2.83%
jan 1, 2000
95.943
-0.694
-0.72%
jan 1, 2001
94.985
-0.958
-1.0%
jan 1, 2002
92.566
-2.42
-2.55%
jan 1, 2003
89.037
-3.529
-3.81%
jan 1, 2004
87.454
-1.583
-1.78%
jan 1, 2005
87.773
+0.319
0.36%
jan 1, 2006
91.239
+3.466
3.95%
jan 1, 2007
95.85
+4.61
5.05%
jan 1, 2008
98.07
+2.22
2.32%
jan 1, 2009
97.449
-0.621
-0.63%
jan 1, 2010
96.736
-0.713
-0.73%
jan 1, 2011
94.797
-1.939
-2.0%
jan 1, 2012
94.388
-0.409
-0.43%
jan 1, 2013
94.736
+0.349
0.37%
jan 1, 2014
96.153
+1.416
1.5%
Ranking of countries by current statistics by years


Comments: