29
/
en
AIzaSyAYiBZKx7MnpbEhh9jyipgxe19OcubqV5w
April 1, 2024
53646
Other small states
OSS
false
2
1
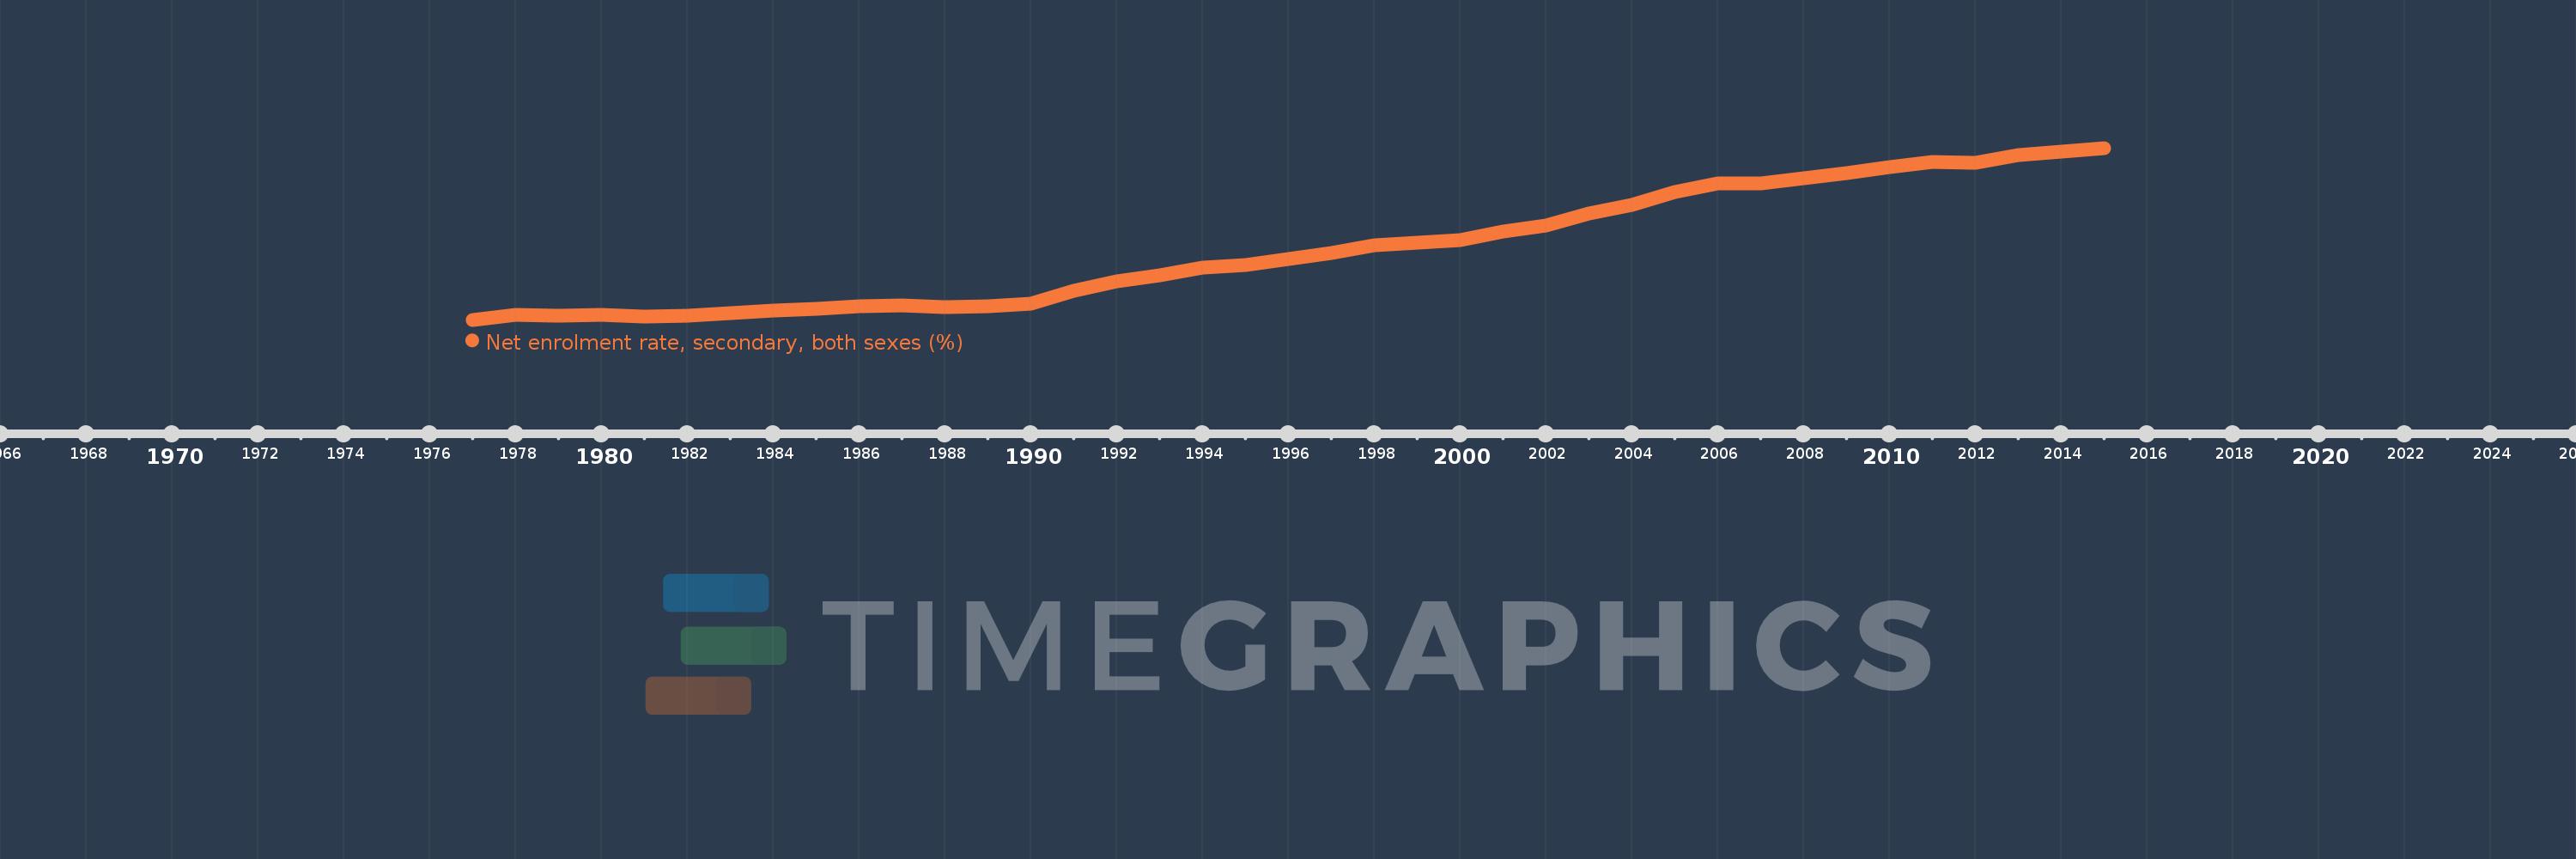
Net enrolment rate, secondary, both sexes (%)
2015,2014,2013,2012,2011,2010,2009,2008,2007,2006,2005,2004,2003,2002,2001,2000,1999,1998,1997,1996,1995,1994,1993,1992,1991,1990,1989,1988,1987,1986,1985,1984,1983,1982,1981,1980,1979,1978,1977
This statistics in other country:
AfghanistanAlbaniaAlgeriaAngolaAntigua and BarbudaArab WorldArgentinaArmeniaArubaAustraliaAustriaAzerbaijanBahamas, TheBahrainBangladeshBarbadosBelarusBelgiumBelizeBeninBermudaBhutanBoliviaBotswanaBrazilBritish Virgin IslandsBrunei DarussalamBulgariaBurkina FasoBurundiCabo VerdeCambodiaCameroonCanadaCaribbean small statesCentral African RepublicCentral Europe and the BalticsChadChileColombiaComorosCongo, Dem. Rep.Congo, Rep.Costa RicaCroatiaCubaCyprusDenmarkDjiboutiDominicaDominican RepublicEarly-demographic dividendEast Asia & PacificEast Asia & Pacific (excluding high income)East Asia & Pacific (IDA & IBRD countries)EcuadorEgypt, Arab Rep.El SalvadorEquatorial GuineaEritreaEstoniaEthiopiaEuro areaEurope & Central AsiaEurope & Central Asia (excluding high income)Europe & Central Asia (IDA & IBRD countries)European UnionFijiFinlandFragile and conflict affected situationsFranceGambia, TheGeorgiaGhanaGreeceGrenadaGuatemalaGuineaGuinea-BissauGuyanaHeavily indebted poor countries (HIPC)High incomeHondurasHong Kong SAR, ChinaHungaryIBRD onlyIcelandIDA & IBRD totalIDA blendIDA onlyIDA totalIndiaIndonesiaIran, Islamic Rep.IraqIrelandIsraelItalyJamaicaJapanJordanKazakhstanKenyaKiribatiKorea, Dem. People’s Rep.Korea, Rep.KuwaitKyrgyz RepublicLao PDRLate-demographic dividendLatin America & Caribbean Latin America & Caribbean (excluding high income)Latin America & the Caribbean (IDA & IBRD countries)LatviaLeast developed countries: UN classificationLebanonLesothoLibyaLiechtensteinLithuaniaLow & middle incomeLow incomeLower middle incomeLuxembourgMacao SAR, ChinaMacedonia, FYRMadagascarMalawiMalaysiaMaldivesMaliMaltaMarshall IslandsMauritaniaMauritiusMexicoMiddle East & North AfricaMiddle East & North Africa (excluding high income)Middle East & North Africa (IDA & IBRD countries)Middle incomeMoldovaMongoliaMoroccoMozambiqueMyanmarNamibiaNauruNepalNetherlandsNew ZealandNicaraguaNigerNorth AmericaNorwayOECD membersOmanOther small statesPacific island small statesPakistanPanamaParaguayPeruPhilippinesPolandPortugalPost-demographic dividendPre-demographic dividendPuerto RicoQatarRomaniaSamoaSao Tome and PrincipeSaudi ArabiaSenegalSerbiaSeychellesSierra LeoneSloveniaSmall statesSolomon IslandsSomaliaSouth AfricaSouth AsiaSouth Asia (IDA & IBRD)SpainSri LankaSt. Kitts and NevisSt. LuciaSt. Vincent and the GrenadinesSub-Saharan Africa Sub-Saharan Africa (excluding high income)Sub-Saharan Africa (IDA & IBRD countries)SurinameSwazilandSwedenSwitzerlandSyrian Arab RepublicTajikistanThailandTimor-LesteTogoTongaTrinidad and TobagoTunisiaTurkeyTuvaluUgandaUkraineUnited Arab EmiratesUnited KingdomUnited StatesUpper middle incomeUruguayVanuatuVenezuela, RBVietnamWest Bank and GazaWorldYemen, Rep.Zimbabwe Timeline:
This timeline shows a graph from 1977 to 2015 of Other small states. No data until 1976. Number of actual observations by date: 39.
Source name:
World Development Indicators
Source organization:
UNESCO Institute for Statistics
Categories, topics:
Education
Last updated:
apr 23, 2017
Indicators value changes by year
Minimum:
32.429
jan 1, 1977
Maximum:
53.582
jan 1, 2015
At the date of observation
Value
Absolute change
Change from previous value
jan 1, 1977
32.429
+32.429
0.0%
jan 1, 1978
32.994
+0.566
1.74%
jan 1, 1979
32.911
-0.084
-0.25%
jan 1, 1980
32.99
+0.079
0.24%
jan 1, 1981
32.832
-0.158
-0.48%
jan 1, 1982
32.875
+0.043
0.13%
jan 1, 1983
33.195
+0.32
0.97%
jan 1, 1984
33.545
+0.35
1.05%
jan 1, 1985
33.79
+0.245
0.73%
jan 1, 1986
34.136
+0.346
1.03%
jan 1, 1987
34.246
+0.109
0.32%
jan 1, 1988
33.998
-0.248
-0.72%
jan 1, 1989
34.052
+0.054
0.16%
jan 1, 1990
34.451
+0.398
1.17%
jan 1, 1991
35.965
+1.515
4.4%
jan 1, 1992
37.126
+1.161
3.23%
jan 1, 1993
37.853
+0.727
1.96%
jan 1, 1994
38.838
+0.985
2.6%
jan 1, 1995
39.131
+0.293
0.76%
jan 1, 1996
39.914
+0.783
2.0%
jan 1, 1997
40.645
+0.731
1.83%
jan 1, 1998
41.59
+0.945
2.32%
jan 1, 1999
41.962
+0.372
0.89%
jan 1, 2000
42.217
+0.255
0.61%
jan 1, 2001
43.275
+1.058
2.51%
jan 1, 2002
44.015
+0.74
1.71%
jan 1, 2003
45.564
+1.549
3.52%
jan 1, 2004
46.551
+0.987
2.17%
jan 1, 2005
48.176
+1.625
3.49%
jan 1, 2006
49.17
+0.994
2.06%
jan 1, 2007
49.228
+0.057
0.12%
jan 1, 2008
49.872
+0.644
1.31%
jan 1, 2009
50.453
+0.582
1.17%
jan 1, 2010
51.253
+0.8
1.59%
jan 1, 2011
51.866
+0.612
1.19%
jan 1, 2012
51.73
-0.136
-0.26%
jan 1, 2013
52.677
+0.947
1.83%
jan 1, 2014
53.172
+0.495
0.94%
jan 1, 2015
53.582
+0.41
0.77%
Ranking of countries by current statistics by years


Comments: