29
/
en
AIzaSyAYiBZKx7MnpbEhh9jyipgxe19OcubqV5w
April 1, 2024
41734
Latin America & Caribbean
LCN
false
2
1
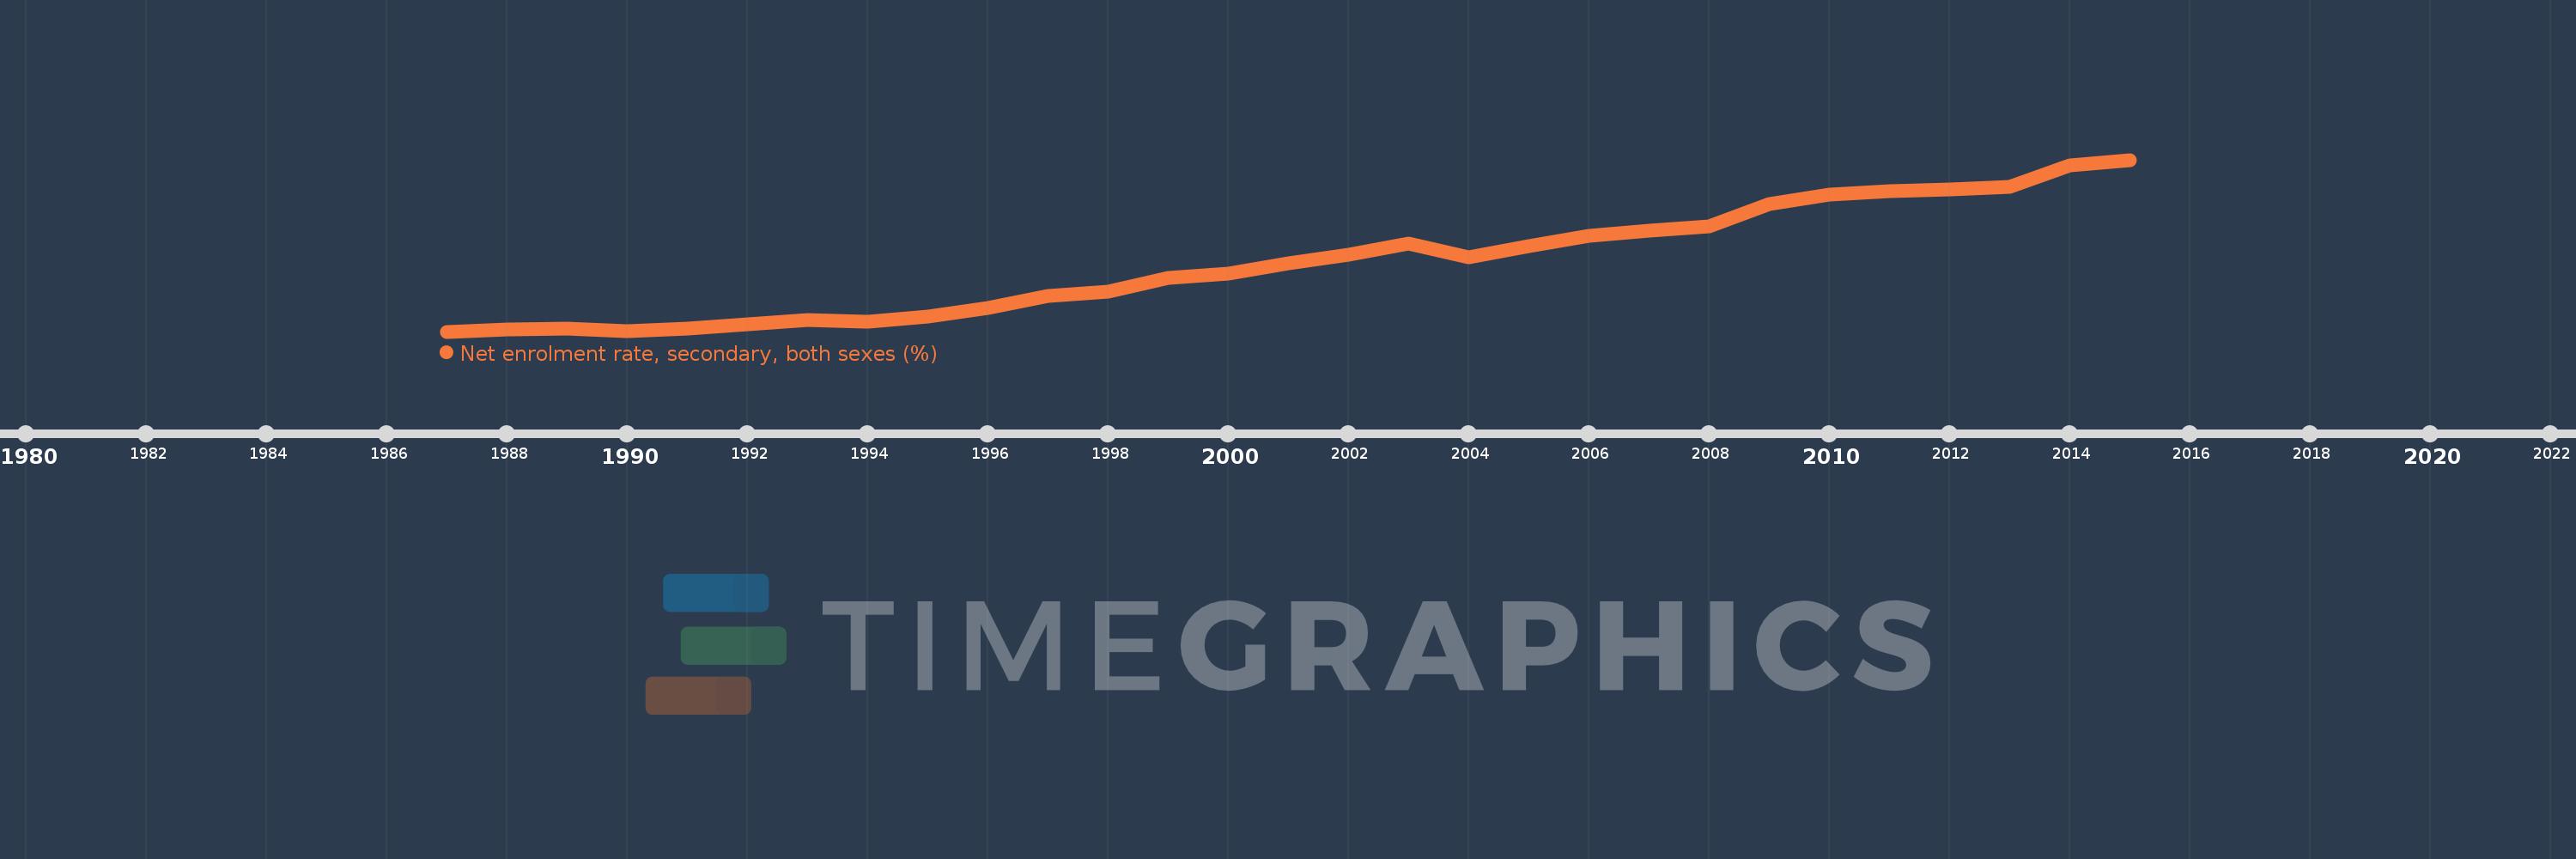
Net enrolment rate, secondary, both sexes (%)
2015,2014,2013,2012,2011,2010,2009,2008,2007,2006,2005,2004,2003,2002,2001,2000,1999,1998,1997,1996,1995,1994,1993,1992,1991,1990,1989,1988,1987
This statistics in other country:
AfghanistanAlbaniaAlgeriaAngolaAntigua and BarbudaArab WorldArgentinaArmeniaArubaAustraliaAustriaAzerbaijanBahamas, TheBahrainBangladeshBarbadosBelarusBelgiumBelizeBeninBermudaBhutanBoliviaBotswanaBrazilBritish Virgin IslandsBrunei DarussalamBulgariaBurkina FasoBurundiCabo VerdeCambodiaCameroonCanadaCaribbean small statesCentral African RepublicCentral Europe and the BalticsChadChileColombiaComorosCongo, Dem. Rep.Congo, Rep.Costa RicaCroatiaCubaCyprusDenmarkDjiboutiDominicaDominican RepublicEarly-demographic dividendEast Asia & PacificEast Asia & Pacific (excluding high income)East Asia & Pacific (IDA & IBRD countries)EcuadorEgypt, Arab Rep.El SalvadorEquatorial GuineaEritreaEstoniaEthiopiaEuro areaEurope & Central AsiaEurope & Central Asia (excluding high income)Europe & Central Asia (IDA & IBRD countries)European UnionFijiFinlandFragile and conflict affected situationsFranceGambia, TheGeorgiaGhanaGreeceGrenadaGuatemalaGuineaGuinea-BissauGuyanaHeavily indebted poor countries (HIPC)High incomeHondurasHong Kong SAR, ChinaHungaryIBRD onlyIcelandIDA & IBRD totalIDA blendIDA onlyIDA totalIndiaIndonesiaIran, Islamic Rep.IraqIrelandIsraelItalyJamaicaJapanJordanKazakhstanKenyaKiribatiKorea, Dem. People’s Rep.Korea, Rep.KuwaitKyrgyz RepublicLao PDRLate-demographic dividendLatin America & Caribbean Latin America & Caribbean (excluding high income)Latin America & the Caribbean (IDA & IBRD countries)LatviaLeast developed countries: UN classificationLebanonLesothoLibyaLiechtensteinLithuaniaLow & middle incomeLow incomeLower middle incomeLuxembourgMacao SAR, ChinaMacedonia, FYRMadagascarMalawiMalaysiaMaldivesMaliMaltaMarshall IslandsMauritaniaMauritiusMexicoMiddle East & North AfricaMiddle East & North Africa (excluding high income)Middle East & North Africa (IDA & IBRD countries)Middle incomeMoldovaMongoliaMoroccoMozambiqueMyanmarNamibiaNauruNepalNetherlandsNew ZealandNicaraguaNigerNorth AmericaNorwayOECD membersOmanOther small statesPacific island small statesPakistanPanamaParaguayPeruPhilippinesPolandPortugalPost-demographic dividendPre-demographic dividendPuerto RicoQatarRomaniaSamoaSao Tome and PrincipeSaudi ArabiaSenegalSerbiaSeychellesSierra LeoneSloveniaSmall statesSolomon IslandsSomaliaSouth AfricaSouth AsiaSouth Asia (IDA & IBRD)SpainSri LankaSt. Kitts and NevisSt. LuciaSt. Vincent and the GrenadinesSub-Saharan Africa Sub-Saharan Africa (excluding high income)Sub-Saharan Africa (IDA & IBRD countries)SurinameSwazilandSwedenSwitzerlandSyrian Arab RepublicTajikistanThailandTimor-LesteTogoTongaTrinidad and TobagoTunisiaTurkeyTuvaluUgandaUkraineUnited Arab EmiratesUnited KingdomUnited StatesUpper middle incomeUruguayVanuatuVenezuela, RBVietnamWest Bank and GazaWorldYemen, Rep.Zimbabwe Timeline:
This timeline shows a graph from 1987 to 2015 of Latin America & Caribbean . No data until 1986. Number of actual observations by date: 29.
Source name:
World Development Indicators
Source organization:
UNESCO Institute for Statistics
Categories, topics:
Education
Last updated:
apr 23, 2017
Indicators value changes by year
Minimum:
58.601
jan 1, 1987
Maximum:
75.859
jan 1, 2015
At the date of observation
Value
Absolute change
Change from previous value
jan 1, 1987
58.601
+58.601
0.0%
jan 1, 1988
58.853
+0.252
0.43%
jan 1, 1989
58.905
+0.052
0.09%
jan 1, 1990
58.628
-0.277
-0.47%
jan 1, 1991
58.866
+0.238
0.41%
jan 1, 1992
59.342
+0.476
0.81%
jan 1, 1993
59.765
+0.423
0.71%
jan 1, 1994
59.622
-0.143
-0.24%
jan 1, 1995
60.128
+0.506
0.85%
jan 1, 1996
60.98
+0.852
1.42%
jan 1, 1997
62.165
+1.185
1.94%
jan 1, 1998
62.611
+0.447
0.72%
jan 1, 1999
64.032
+1.421
2.27%
jan 1, 2000
64.386
+0.354
0.55%
jan 1, 2001
65.491
+1.106
1.72%
jan 1, 2002
66.359
+0.868
1.33%
jan 1, 2003
67.407
+1.048
1.58%
jan 1, 2004
66.052
-1.356
-2.01%
jan 1, 2005
67.229
+1.177
1.78%
jan 1, 2006
68.246
+1.018
1.51%
jan 1, 2007
68.781
+0.534
0.78%
jan 1, 2008
69.147
+0.366
0.53%
jan 1, 2009
71.427
+2.281
3.3%
jan 1, 2010
72.341
+0.914
1.28%
jan 1, 2011
72.694
+0.352
0.49%
jan 1, 2012
72.877
+0.184
0.25%
jan 1, 2013
73.182
+0.304
0.42%
jan 1, 2014
75.272
+2.09
2.86%
jan 1, 2015
75.859
+0.587
0.78%
Ranking of countries by current statistics by years


Comments: