29
/
en
AIzaSyAYiBZKx7MnpbEhh9jyipgxe19OcubqV5w
April 1, 2024
247855
Spain
ESP
true
2
1
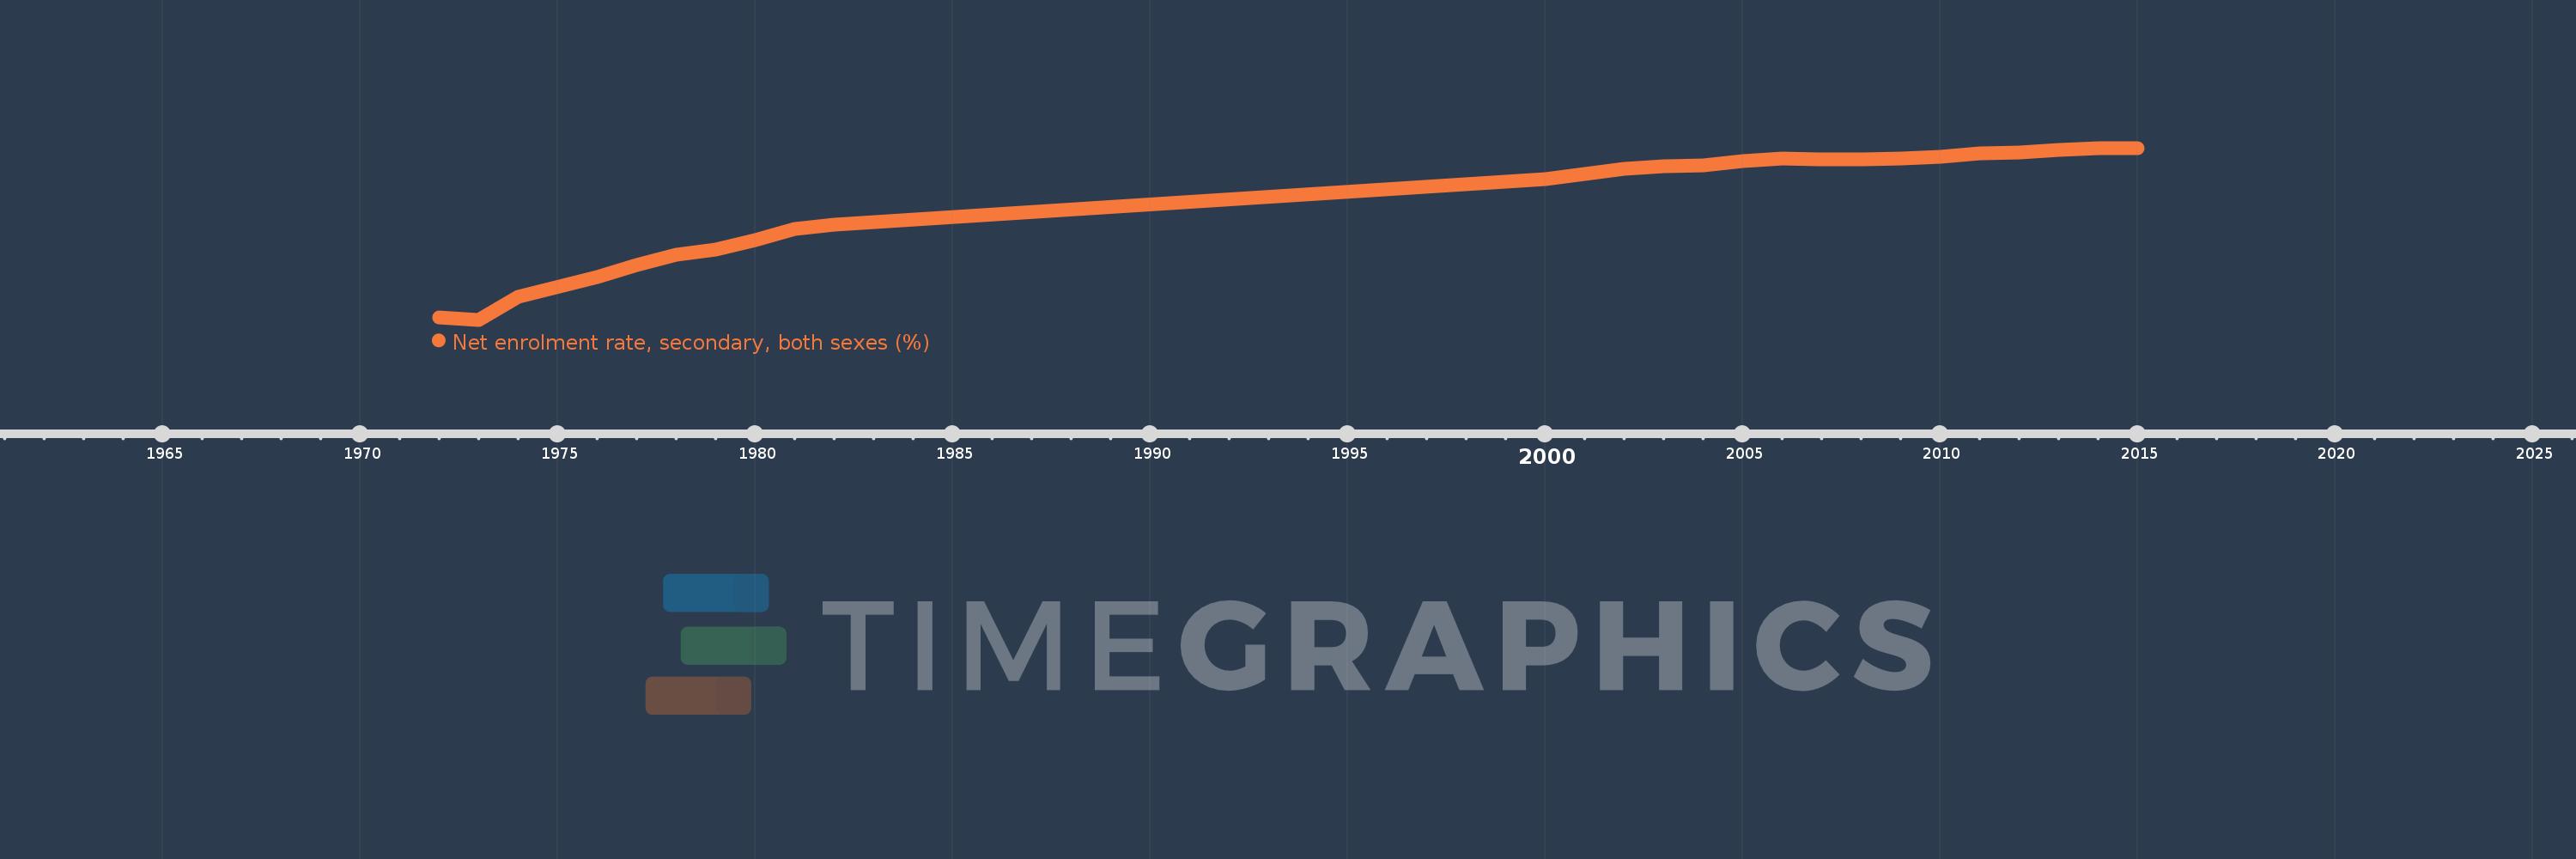
Net enrolment rate, secondary, both sexes (%)
2015,2014,2013,2012,2011,2010,2009,2008,2007,2006,2005,2004,2003,2002,2001,2000,1982,1981,1980,1979,1978,1977,1976,1974,1973,1972
This statistics in other country:
AfghanistanAlbaniaAlgeriaAngolaAntigua and BarbudaArab WorldArgentinaArmeniaArubaAustraliaAustriaAzerbaijanBahamas, TheBahrainBangladeshBarbadosBelarusBelgiumBelizeBeninBermudaBhutanBoliviaBotswanaBrazilBritish Virgin IslandsBrunei DarussalamBulgariaBurkina FasoBurundiCabo VerdeCambodiaCameroonCanadaCaribbean small statesCentral African RepublicCentral Europe and the BalticsChadChileColombiaComorosCongo, Dem. Rep.Congo, Rep.Costa RicaCroatiaCubaCyprusDenmarkDjiboutiDominicaDominican RepublicEarly-demographic dividendEast Asia & PacificEast Asia & Pacific (excluding high income)East Asia & Pacific (IDA & IBRD countries)EcuadorEgypt, Arab Rep.El SalvadorEquatorial GuineaEritreaEstoniaEthiopiaEuro areaEurope & Central AsiaEurope & Central Asia (excluding high income)Europe & Central Asia (IDA & IBRD countries)European UnionFijiFinlandFragile and conflict affected situationsFranceGambia, TheGeorgiaGhanaGreeceGrenadaGuatemalaGuineaGuinea-BissauGuyanaHeavily indebted poor countries (HIPC)High incomeHondurasHong Kong SAR, ChinaHungaryIBRD onlyIcelandIDA & IBRD totalIDA blendIDA onlyIDA totalIndiaIndonesiaIran, Islamic Rep.IraqIrelandIsraelItalyJamaicaJapanJordanKazakhstanKenyaKiribatiKorea, Dem. People’s Rep.Korea, Rep.KuwaitKyrgyz RepublicLao PDRLate-demographic dividendLatin America & Caribbean Latin America & Caribbean (excluding high income)Latin America & the Caribbean (IDA & IBRD countries)LatviaLeast developed countries: UN classificationLebanonLesothoLibyaLiechtensteinLithuaniaLow & middle incomeLow incomeLower middle incomeLuxembourgMacao SAR, ChinaMacedonia, FYRMadagascarMalawiMalaysiaMaldivesMaliMaltaMarshall IslandsMauritaniaMauritiusMexicoMiddle East & North AfricaMiddle East & North Africa (excluding high income)Middle East & North Africa (IDA & IBRD countries)Middle incomeMoldovaMongoliaMoroccoMozambiqueMyanmarNamibiaNauruNepalNetherlandsNew ZealandNicaraguaNigerNorth AmericaNorwayOECD membersOmanOther small statesPacific island small statesPakistanPanamaParaguayPeruPhilippinesPolandPortugalPost-demographic dividendPre-demographic dividendPuerto RicoQatarRomaniaSamoaSao Tome and PrincipeSaudi ArabiaSenegalSerbiaSeychellesSierra LeoneSloveniaSmall statesSolomon IslandsSomaliaSouth AfricaSouth AsiaSouth Asia (IDA & IBRD)SpainSri LankaSt. Kitts and NevisSt. LuciaSt. Vincent and the GrenadinesSub-Saharan Africa Sub-Saharan Africa (excluding high income)Sub-Saharan Africa (IDA & IBRD countries)SurinameSwazilandSwedenSwitzerlandSyrian Arab RepublicTajikistanThailandTimor-LesteTogoTongaTrinidad and TobagoTunisiaTurkeyTuvaluUgandaUkraineUnited Arab EmiratesUnited KingdomUnited StatesUpper middle incomeUruguayVanuatuVenezuela, RBVietnamWest Bank and GazaWorldYemen, Rep.Zimbabwe Timeline:
This timeline shows a graph from 1972 to 2015 of Spain. No data until 1971. Number of actual observations by date: 26.
Source name:
World Development Indicators
Source organization:
UNESCO Institute for Statistics
Categories, topics:
Education
Last updated:
apr 23, 2017
Indicators value changes by year
Minimum:
45.176
jan 1, 1973
Maximum:
96.459
jan 1, 2015
At the date of observation
Value
Absolute change
Change from previous value
jan 1, 1972
45.945
+45.945
0.0%
jan 1, 1973
45.176
-0.769
-1.67%
jan 1, 1974
52.027
+6.85
15.16%
jan 1, 1976
58.013
+5.986
11.51%
jan 1, 1977
61.428
+3.416
5.89%
jan 1, 1978
64.488
+3.06
4.98%
jan 1, 1979
66.236
+1.748
2.71%
jan 1, 1980
69.062
+2.826
4.27%
jan 1, 1981
72.4
+3.338
4.83%
jan 1, 1982
73.55
+1.15
1.59%
jan 1, 2000
87.216
+13.666
18.58%
jan 1, 2001
88.763
+1.547
1.77%
jan 1, 2002
90.348
+1.585
1.79%
jan 1, 2003
90.954
+0.606
0.67%
jan 1, 2004
91.351
+0.396
0.44%
jan 1, 2005
92.519
+1.168
1.28%
jan 1, 2006
93.407
+0.889
0.96%
jan 1, 2007
93.026
-0.381
-0.41%
jan 1, 2008
92.983
-0.043
-0.05%
jan 1, 2009
93.203
+0.22
0.24%
jan 1, 2010
93.735
+0.532
0.57%
jan 1, 2011
94.887
+1.152
1.23%
jan 1, 2012
95.059
+0.171
0.18%
jan 1, 2013
95.799
+0.74
0.78%
jan 1, 2014
96.339
+0.54
0.56%
jan 1, 2015
96.459
+0.12
0.12%
Ranking of countries by current statistics by years


Comments: