29
/pt/
pt
AIzaSyAYiBZKx7MnpbEhh9jyipgxe19OcubqV5w
April 1, 2024
97012
Cabo Verde
CPV
true
2
1
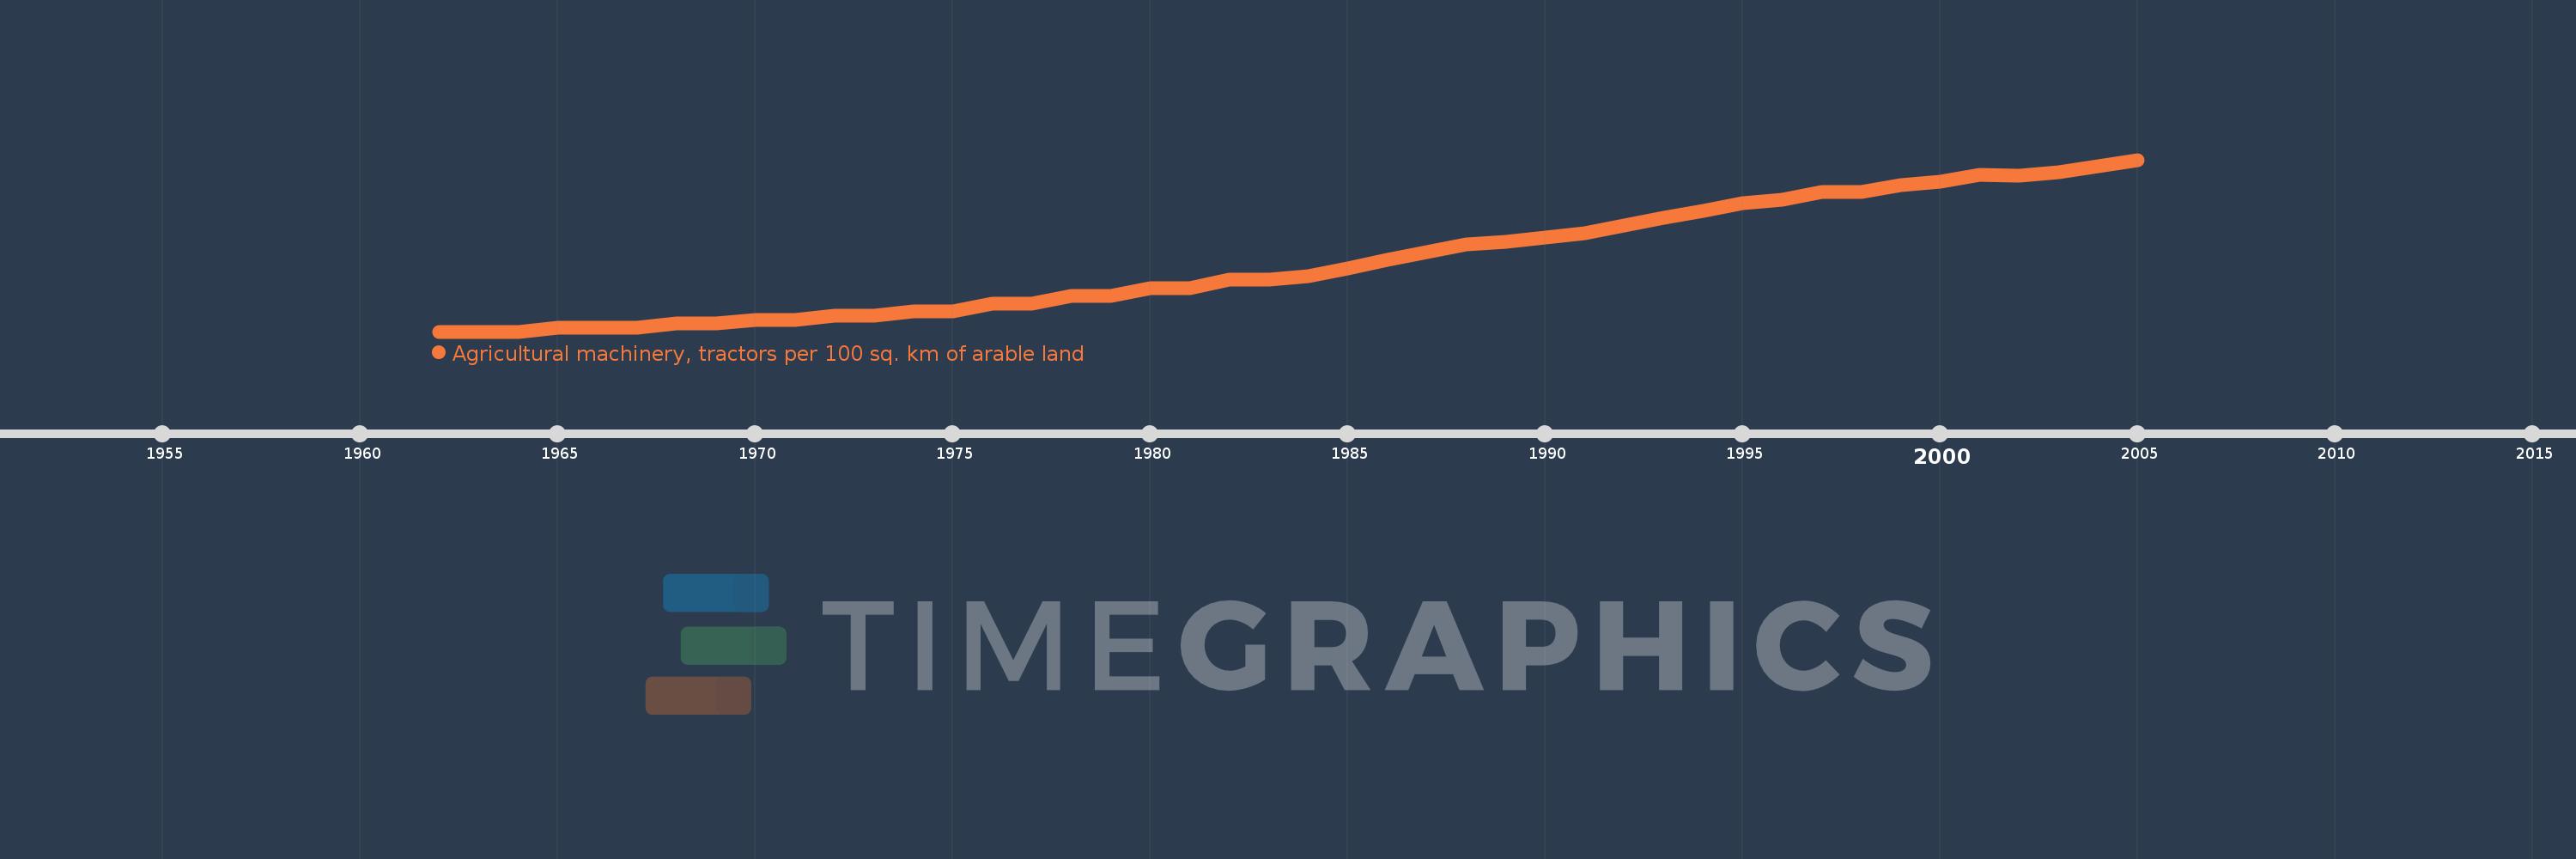
Agricultural machinery, tractors per 100 sq. km of arable land
2005,2004,2003,2002,2001,2000,1999,1998,1997,1996,1995,1994,1993,1992,1991,1990,1989,1988,1987,1986,1985,1984,1983,1982,1981,1980,1979,1978,1977,1976,1975,1974,1973,1972,1971,1970,1969,1968,1967,1966,1965,1964,1963,1962
Estas estatísticas em outros países:
AfghanistanAlbaniaAlgeriaAmerican SamoaAndorraAngolaAntigua and BarbudaArab WorldArgentinaArmeniaAustraliaAustriaAzerbaijanBahamas, TheBahrainBangladeshBarbadosBelarusBelgiumBelizeBeninBermudaBhutanBoliviaBosnia and HerzegovinaBotswanaBrazilBritish Virgin IslandsBrunei DarussalamBulgariaBurkina FasoBurundiCabo VerdeCambodiaCameroonCanadaCaribbean small statesCentral African RepublicCentral Europe and the BalticsChadChileChinaColombiaCongo, Dem. Rep.Congo, Rep.Costa RicaCote d'IvoireCroatiaCubaCyprusCzech RepublicDenmarkDjiboutiDominicaDominican RepublicEarly-demographic dividendEast Asia & PacificEast Asia & Pacific (excluding high income)East Asia & Pacific (IDA & IBRD countries)EcuadorEgypt, Arab Rep.El SalvadorEritreaEstoniaEuro areaEurope & Central AsiaEurope & Central Asia (excluding high income)Europe & Central Asia (IDA & IBRD countries)European UnionFijiFinlandFragile and conflict affected situationsFranceFrench PolynesiaGambia, TheGeorgiaGermanyGhanaGreeceGrenadaGuamGuatemalaGuineaGuinea-BissauGuyanaHaitiHeavily indebted poor countries (HIPC)High incomeHondurasHungaryIBRD onlyIcelandIDA & IBRD totalIDA blendIDA onlyIDA totalIndiaIndonesiaIran, Islamic Rep.IraqIrelandIsraelItalyJamaicaJapanJordanKazakhstanKenyaKiribatiKorea, Dem. People’s Rep.Korea, Rep.KuwaitKyrgyz RepublicLao PDRLate-demographic dividendLatin America & Caribbean Latin America & Caribbean (excluding high income)Latin America & the Caribbean (IDA & IBRD countries)LatviaLeast developed countries: UN classificationLebanonLesothoLibyaLiechtensteinLithuaniaLow & middle incomeLow incomeLower middle incomeLuxembourgMacedonia, FYRMadagascarMalawiMalaysiaMaliMaltaMauritaniaMauritiusMexicoMiddle East & North AfricaMiddle East & North Africa (excluding high income)Middle East & North Africa (IDA & IBRD countries)Middle incomeMoldovaMongoliaMoroccoMozambiqueMyanmarNepalNetherlandsNew CaledoniaNew ZealandNicaraguaNigerNigeriaNorth AmericaNorthern Mariana IslandsNorwayOECD membersOmanOther small statesPakistanPanamaPapua New GuineaParaguayPeruPhilippinesPolandPortugalPost-demographic dividendPre-demographic dividendPuerto RicoQatarRomaniaRussian FederationRwandaSamoaSao Tome and PrincipeSaudi ArabiaSenegalSerbiaSeychellesSierra LeoneSlovak RepublicSloveniaSmall statesSolomon IslandsSomaliaSouth AfricaSouth AsiaSouth Asia (IDA & IBRD)SpainSri LankaSt. Kitts and NevisSt. LuciaSt. Vincent and the GrenadinesSub-Saharan Africa Sub-Saharan Africa (excluding high income)Sub-Saharan Africa (IDA & IBRD countries)SudanSurinameSwazilandSwedenSwitzerlandSyrian Arab RepublicTajikistanTanzaniaThailandTimor-LesteTogoTongaTrinidad and TobagoTunisiaTurkeyTurkmenistanUgandaUkraineUnited Arab EmiratesUnited KingdomUnited StatesUpper middle incomeUruguayVanuatuVenezuela, RBVietnamVirgin Islands (U.S.)West Bank and GazaWorldYemen, Rep.ZambiaZimbabwe Linha do tempo:
Nesta escala de tempo está apresentado um gráfico de 1962 ano até 2005 ano Cabo Verde. Dados de 1961 ano ausente. O número de observações reais por data: 44.
Fonte (nome):
Indicadores de desenvolvimento mundial
Fonte (organização):
Food and Agriculture Organization, electronic files and web site.
Categorias:
Agriculture & Rural Development
Foi atualizado:
23 abr 2017 ano
Indicadores de alterações dos valores ao longo dos anos
Mínimo:
0.526
1 jan 1962 ano
Máximo:
11.915
1 jan 2005 ano
Na data de observação
Valor
Mudança absoluta
A alteração em relação ao valor anterior
1 jan 1962 ano
0.526
+0.526
0.0%
1 jan 1963 ano
0.526
0.0
0.0%
1 jan 1964 ano
0.526
0.0
0.0%
1 jan 1965 ano
0.789
+0.263
50.0%
1 jan 1966 ano
0.789
0.0
0.0%
1 jan 1967 ano
0.789
0.0
0.0%
1 jan 1968 ano
1.053
+0.263
33.33%
1 jan 1969 ano
1.053
0.0
0.0%
1 jan 1970 ano
1.316
+0.263
25.0%
1 jan 1971 ano
1.316
0.0
0.0%
1 jan 1972 ano
1.579
+0.263
20.0%
1 jan 1973 ano
1.579
0.0
0.0%
1 jan 1974 ano
1.842
+0.263
16.67%
1 jan 1975 ano
1.842
0.0
0.0%
1 jan 1976 ano
2.368
+0.526
28.57%
1 jan 1977 ano
2.368
0.0
0.0%
1 jan 1978 ano
2.895
+0.526
22.22%
1 jan 1979 ano
2.895
0.0
0.0%
1 jan 1980 ano
3.421
+0.526
18.18%
1 jan 1981 ano
3.421
0.0
0.0%
1 jan 1982 ano
3.947
+0.526
15.38%
1 jan 1983 ano
3.947
0.0
0.0%
1 jan 1984 ano
4.211
+0.263
6.67%
1 jan 1985 ano
4.737
+0.526
12.5%
1 jan 1986 ano
5.263
+0.526
11.11%
1 jan 1987 ano
5.789
+0.526
10.0%
1 jan 1988 ano
6.316
+0.526
9.09%
1 jan 1989 ano
6.5
+0.184
2.92%
1 jan 1990 ano
6.75
+0.25
3.85%
1 jan 1991 ano
7.073
+0.323
4.79%
1 jan 1992 ano
7.561
+0.488
6.9%
1 jan 1993 ano
8.049
+0.488
6.45%
1 jan 1994 ano
8.537
+0.488
6.06%
1 jan 1995 ano
9.024
+0.488
5.71%
1 jan 1996 ano
9.286
+0.261
2.9%
1 jan 1997 ano
9.762
+0.476
5.13%
1 jan 1998 ano
9.773
+0.011
0.11%
1 jan 1999 ano
10.227
+0.455
4.65%
1 jan 2000 ano
10.455
+0.227
2.22%
1 jan 2001 ano
10.909
+0.455
4.35%
1 jan 2002 ano
10.87
-0.04
-0.36%
1 jan 2003 ano
11.064
+0.194
1.79%
1 jan 2004 ano
11.489
+0.426
3.85%
1 jan 2005 ano
11.915
+0.426
3.7%
Classificação de países por estatísticas atuais por anos


Comentários: