29
/pt/
pt
AIzaSyAYiBZKx7MnpbEhh9jyipgxe19OcubqV5w
April 1, 2024
124434
Egypt, Arab Rep.
EGY
true
2
1
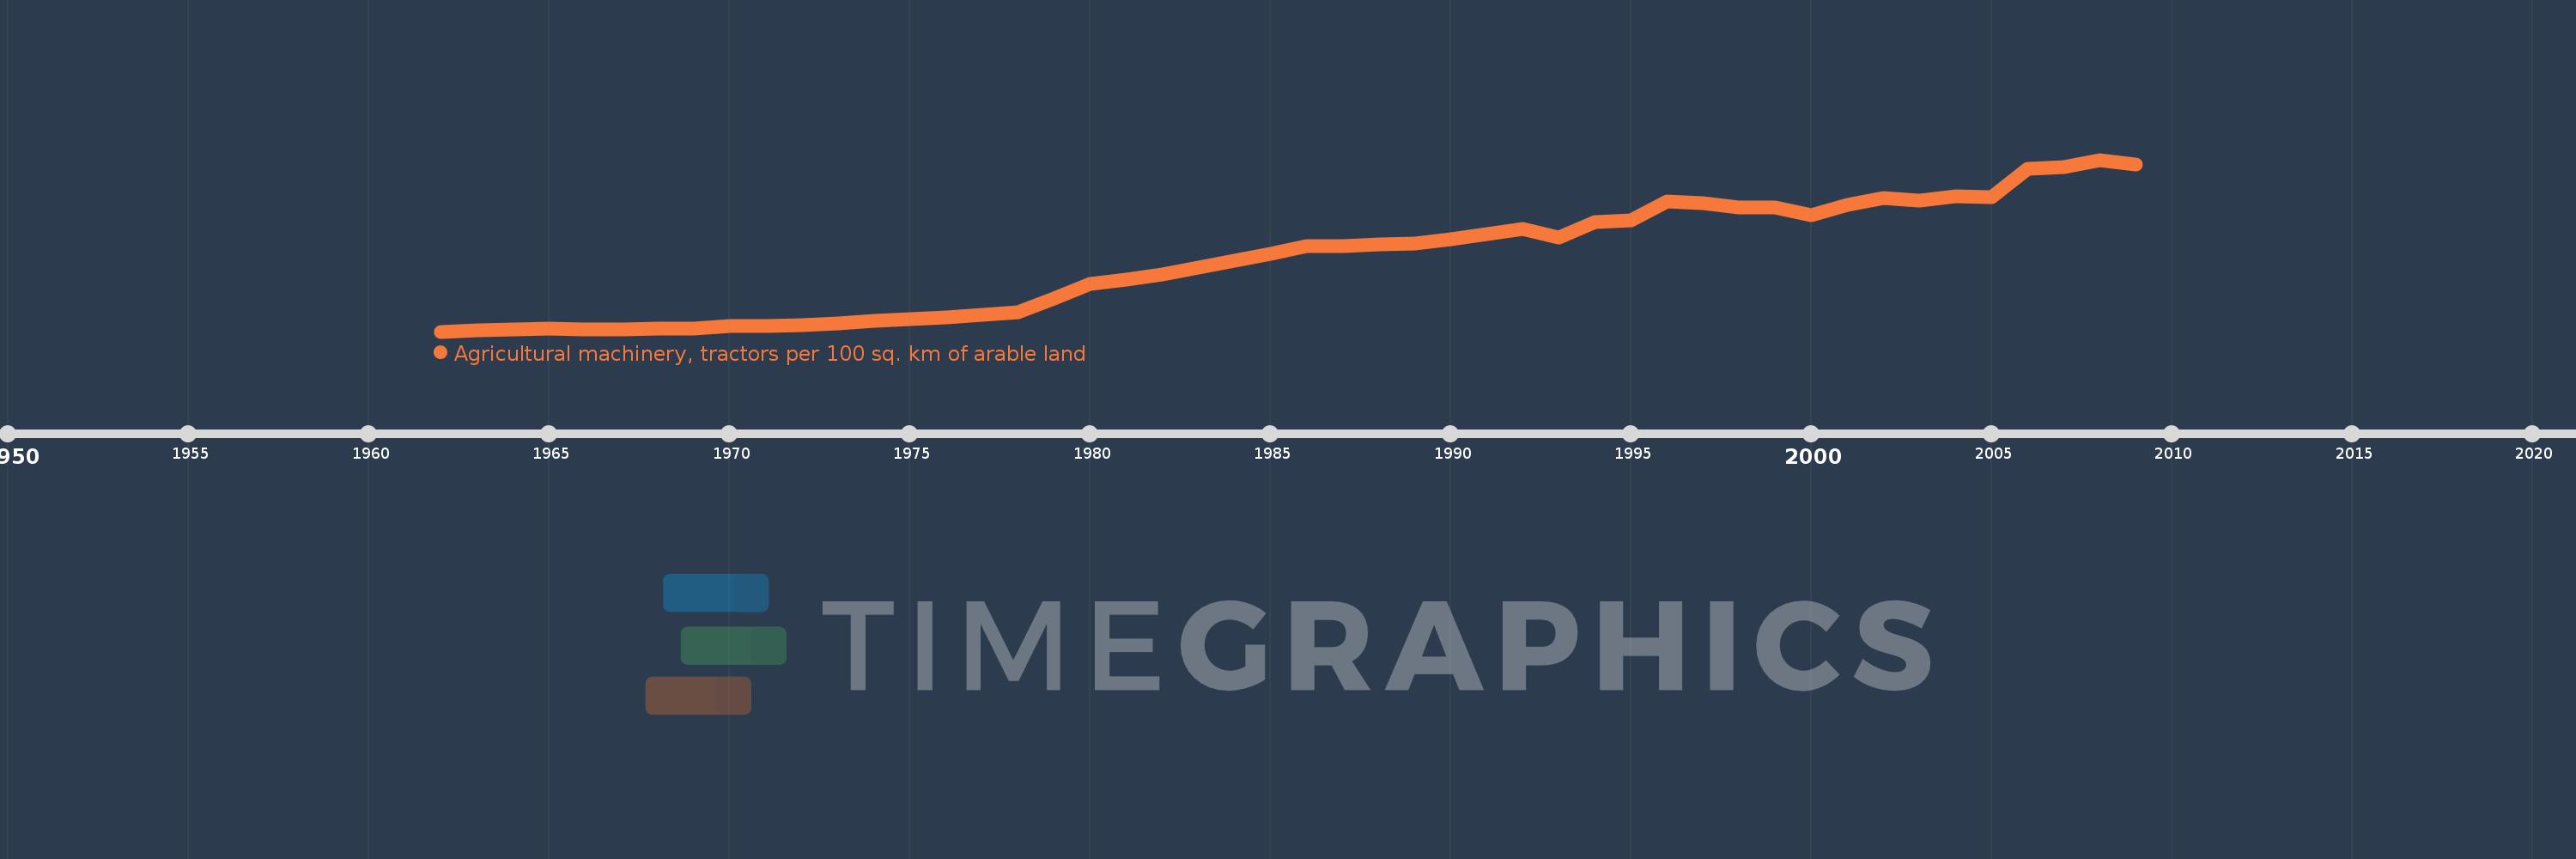
Agricultural machinery, tractors per 100 sq. km of arable land
2009,2008,2007,2006,2005,2004,2003,2002,2001,2000,1999,1998,1997,1996,1995,1994,1993,1992,1991,1990,1989,1988,1987,1986,1985,1984,1983,1982,1981,1980,1979,1978,1977,1976,1975,1974,1973,1972,1971,1970,1969,1968,1967,1966,1965,1964,1963,1962
Estas estatísticas em outros países:
AfghanistanAlbaniaAlgeriaAmerican SamoaAndorraAngolaAntigua and BarbudaArab WorldArgentinaArmeniaAustraliaAustriaAzerbaijanBahamas, TheBahrainBangladeshBarbadosBelarusBelgiumBelizeBeninBermudaBhutanBoliviaBosnia and HerzegovinaBotswanaBrazilBritish Virgin IslandsBrunei DarussalamBulgariaBurkina FasoBurundiCabo VerdeCambodiaCameroonCanadaCaribbean small statesCentral African RepublicCentral Europe and the BalticsChadChileChinaColombiaCongo, Dem. Rep.Congo, Rep.Costa RicaCote d'IvoireCroatiaCubaCyprusCzech RepublicDenmarkDjiboutiDominicaDominican RepublicEarly-demographic dividendEast Asia & PacificEast Asia & Pacific (excluding high income)East Asia & Pacific (IDA & IBRD countries)EcuadorEgypt, Arab Rep.El SalvadorEritreaEstoniaEuro areaEurope & Central AsiaEurope & Central Asia (excluding high income)Europe & Central Asia (IDA & IBRD countries)European UnionFijiFinlandFragile and conflict affected situationsFranceFrench PolynesiaGambia, TheGeorgiaGermanyGhanaGreeceGrenadaGuamGuatemalaGuineaGuinea-BissauGuyanaHaitiHeavily indebted poor countries (HIPC)High incomeHondurasHungaryIBRD onlyIcelandIDA & IBRD totalIDA blendIDA onlyIDA totalIndiaIndonesiaIran, Islamic Rep.IraqIrelandIsraelItalyJamaicaJapanJordanKazakhstanKenyaKiribatiKorea, Dem. People’s Rep.Korea, Rep.KuwaitKyrgyz RepublicLao PDRLate-demographic dividendLatin America & Caribbean Latin America & Caribbean (excluding high income)Latin America & the Caribbean (IDA & IBRD countries)LatviaLeast developed countries: UN classificationLebanonLesothoLibyaLiechtensteinLithuaniaLow & middle incomeLow incomeLower middle incomeLuxembourgMacedonia, FYRMadagascarMalawiMalaysiaMaliMaltaMauritaniaMauritiusMexicoMiddle East & North AfricaMiddle East & North Africa (excluding high income)Middle East & North Africa (IDA & IBRD countries)Middle incomeMoldovaMongoliaMoroccoMozambiqueMyanmarNepalNetherlandsNew CaledoniaNew ZealandNicaraguaNigerNigeriaNorth AmericaNorthern Mariana IslandsNorwayOECD membersOmanOther small statesPakistanPanamaPapua New GuineaParaguayPeruPhilippinesPolandPortugalPost-demographic dividendPre-demographic dividendPuerto RicoQatarRomaniaRussian FederationRwandaSamoaSao Tome and PrincipeSaudi ArabiaSenegalSerbiaSeychellesSierra LeoneSlovak RepublicSloveniaSmall statesSolomon IslandsSomaliaSouth AfricaSouth AsiaSouth Asia (IDA & IBRD)SpainSri LankaSt. Kitts and NevisSt. LuciaSt. Vincent and the GrenadinesSub-Saharan Africa Sub-Saharan Africa (excluding high income)Sub-Saharan Africa (IDA & IBRD countries)SudanSurinameSwazilandSwedenSwitzerlandSyrian Arab RepublicTajikistanTanzaniaThailandTimor-LesteTogoTongaTrinidad and TobagoTunisiaTurkeyTurkmenistanUgandaUkraineUnited Arab EmiratesUnited KingdomUnited StatesUpper middle incomeUruguayVanuatuVenezuela, RBVietnamVirgin Islands (U.S.)West Bank and GazaWorldYemen, Rep.ZambiaZimbabwe Linha do tempo:
Nesta escala de tempo está apresentado um gráfico de 1962 ano até 2009 ano Egypt, Arab Rep.. Dados de 1961 ano ausente. O número de observações reais por data: 48.
Fonte (nome):
Indicadores de desenvolvimento mundial
Fonte (organização):
Food and Agriculture Organization, electronic files and web site.
Categorias:
Agriculture & Rural Development
Foi atualizado:
23 abr 2017 ano
Indicadores de alterações dos valores ao longo dos anos
Mínimo:
51.369
1 jan 1962 ano
Máximo:
400.094
1 jan 2008 ano
Na data de observação
Valor
Mudança absoluta
A alteração em relação ao valor anterior
1 jan 1962 ano
51.369
+51.369
0.0%
1 jan 1963 ano
54.254
+2.885
5.62%
1 jan 1964 ano
55.947
+1.693
3.12%
1 jan 1965 ano
57.803
+1.857
3.32%
1 jan 1966 ano
56.158
-1.645
-2.85%
1 jan 1967 ano
55.908
-0.25
-0.45%
1 jan 1968 ano
57.164
+1.257
2.25%
1 jan 1969 ano
57.953
+0.789
1.38%
1 jan 1970 ano
62.246
+4.293
7.41%
1 jan 1971 ano
63.486
+1.24
1.99%
1 jan 1972 ano
64.227
+0.74
1.17%
1 jan 1973 ano
67.89
+3.663
5.7%
1 jan 1974 ano
73.581
+5.691
8.38%
1 jan 1975 ano
77.167
+3.586
4.87%
1 jan 1976 ano
79.896
+2.729
3.54%
1 jan 1977 ano
84.746
+4.85
6.07%
1 jan 1978 ano
89.908
+5.162
6.09%
1 jan 1979 ano
118.163
+28.255
31.43%
1 jan 1980 ano
148.39
+30.227
25.58%
1 jan 1981 ano
157.48
+9.091
6.13%
1 jan 1982 ano
167.486
+10.006
6.35%
1 jan 1983 ano
181.779
+14.293
8.53%
1 jan 1984 ano
195.841
+14.062
7.74%
1 jan 1985 ano
209.957
+14.116
7.21%
1 jan 1986 ano
224.972
+15.015
7.15%
1 jan 1987 ano
224.331
-0.64
-0.28%
1 jan 1988 ano
228.54
+4.209
1.88%
1 jan 1989 ano
229.437
+0.897
0.39%
1 jan 1990 ano
239.547
+10.11
4.41%
1 jan 1991 ano
249.562
+10.015
4.18%
1 jan 1992 ano
260.256
+10.694
4.28%
1 jan 1993 ano
242.16
-18.096
-6.95%
1 jan 1994 ano
274.32
+32.161
13.28%
1 jan 1995 ano
277.041
+2.721
0.99%
1 jan 1996 ano
316.223
+39.181
14.14%
1 jan 1997 ano
312.057
-4.166
-1.32%
1 jan 1998 ano
303.458
-8.599
-2.76%
1 jan 1999 ano
303.458
0.0
0.0%
1 jan 2000 ano
287.241
-16.217
-5.34%
1 jan 2001 ano
307.944
+20.702
7.21%
1 jan 2002 ano
322.275
+14.332
4.65%
1 jan 2003 ano
317.916
-4.36
-1.35%
1 jan 2004 ano
325.127
+7.212
2.27%
1 jan 2005 ano
324.671
-0.456
-0.14%
1 jan 2006 ano
382.563
+57.892
17.83%
1 jan 2007 ano
385.094
+2.531
0.66%
1 jan 2008 ano
400.094
+15.0
3.9%
1 jan 2009 ano
390.568
-9.526
-2.38%
Classificação de países por estatísticas atuais por anos


Comentários: