29
/pt/
pt
AIzaSyAYiBZKx7MnpbEhh9jyipgxe19OcubqV5w
April 1, 2024
93218
Bulgaria
BGR
true
2
1
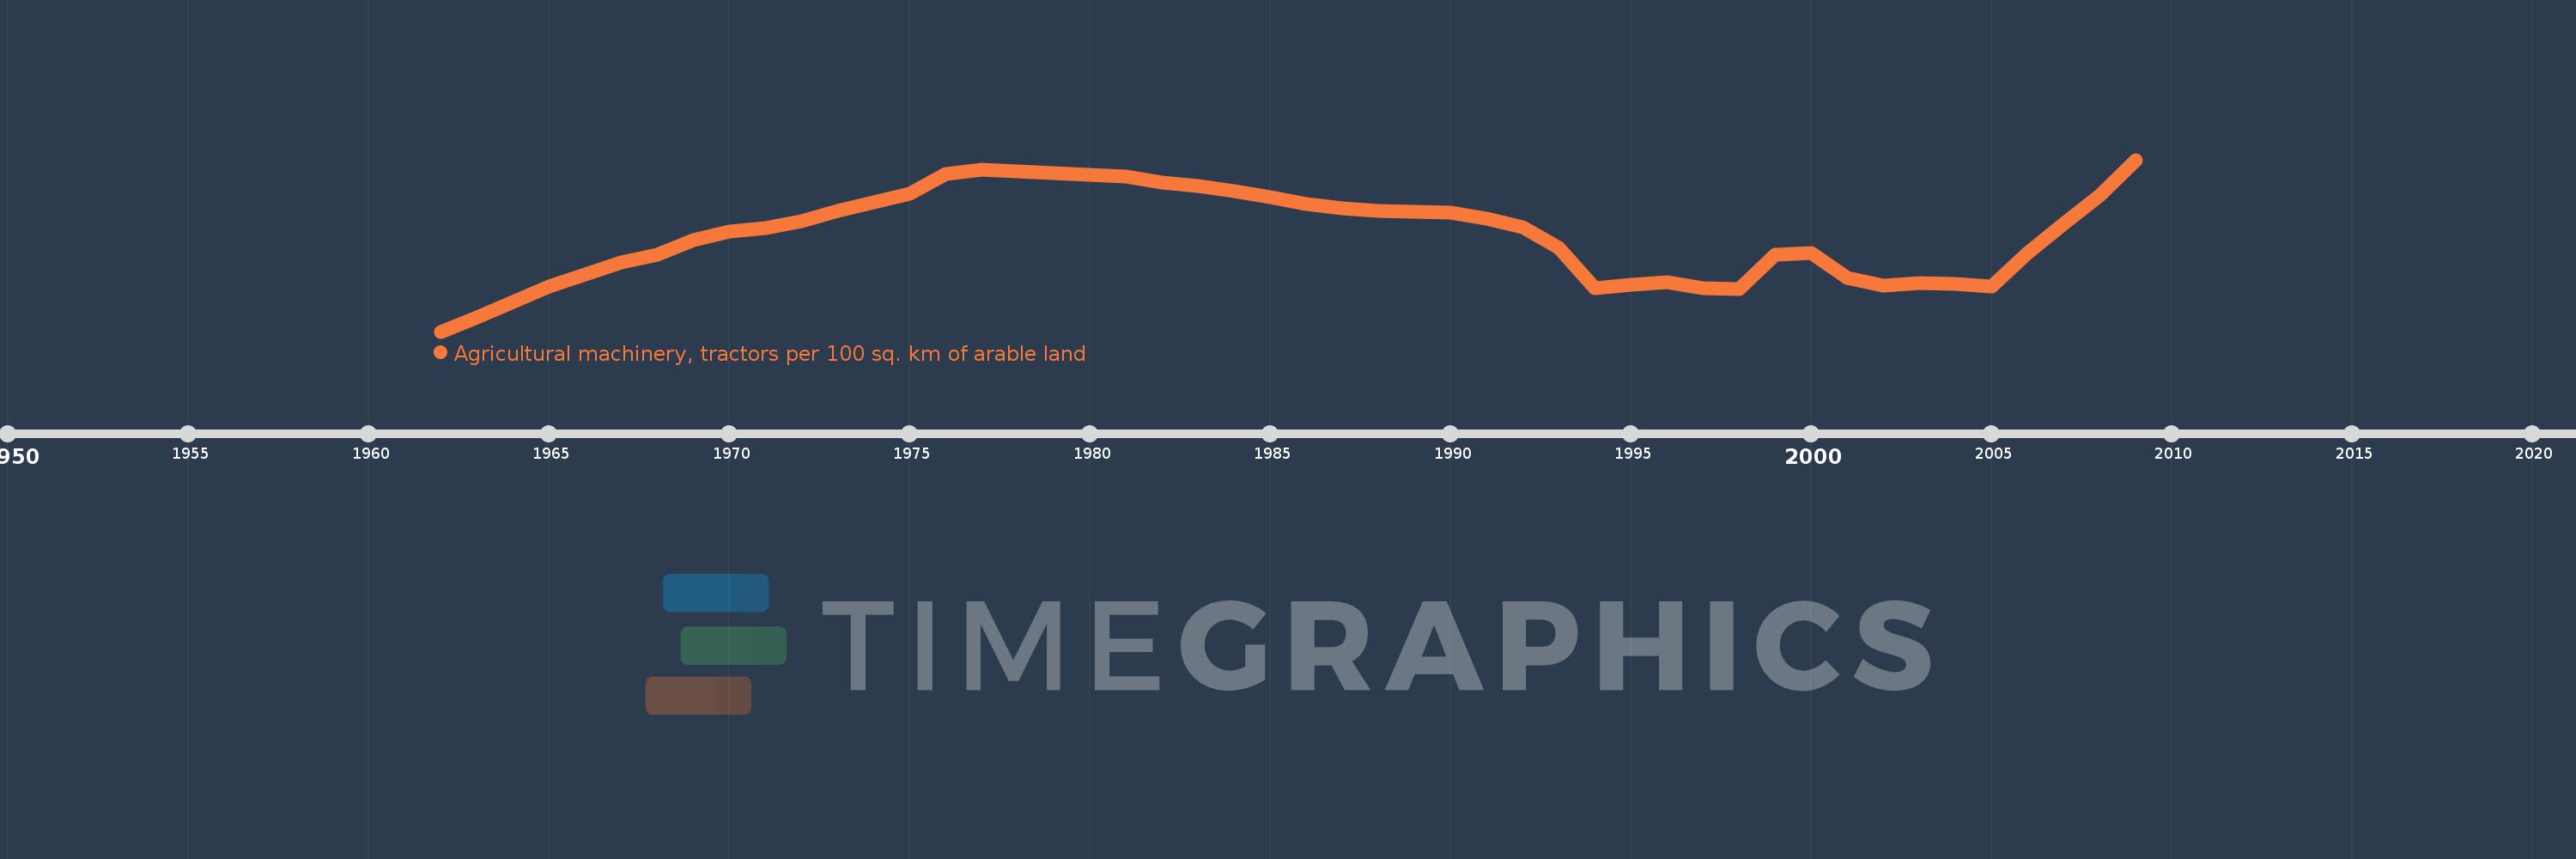
Agricultural machinery, tractors per 100 sq. km of arable land
2009,2008,2007,2006,2005,2004,2003,2002,2001,2000,1999,1998,1997,1996,1995,1994,1993,1992,1991,1990,1989,1988,1987,1986,1985,1984,1983,1982,1981,1980,1979,1978,1977,1976,1975,1974,1973,1972,1971,1970,1969,1968,1967,1966,1965,1964,1963,1962
Estas estatísticas em outros países:
AfghanistanAlbaniaAlgeriaAmerican SamoaAndorraAngolaAntigua and BarbudaArab WorldArgentinaArmeniaAustraliaAustriaAzerbaijanBahamas, TheBahrainBangladeshBarbadosBelarusBelgiumBelizeBeninBermudaBhutanBoliviaBosnia and HerzegovinaBotswanaBrazilBritish Virgin IslandsBrunei DarussalamBulgariaBurkina FasoBurundiCabo VerdeCambodiaCameroonCanadaCaribbean small statesCentral African RepublicCentral Europe and the BalticsChadChileChinaColombiaCongo, Dem. Rep.Congo, Rep.Costa RicaCote d'IvoireCroatiaCubaCyprusCzech RepublicDenmarkDjiboutiDominicaDominican RepublicEarly-demographic dividendEast Asia & PacificEast Asia & Pacific (excluding high income)East Asia & Pacific (IDA & IBRD countries)EcuadorEgypt, Arab Rep.El SalvadorEritreaEstoniaEuro areaEurope & Central AsiaEurope & Central Asia (excluding high income)Europe & Central Asia (IDA & IBRD countries)European UnionFijiFinlandFragile and conflict affected situationsFranceFrench PolynesiaGambia, TheGeorgiaGermanyGhanaGreeceGrenadaGuamGuatemalaGuineaGuinea-BissauGuyanaHaitiHeavily indebted poor countries (HIPC)High incomeHondurasHungaryIBRD onlyIcelandIDA & IBRD totalIDA blendIDA onlyIDA totalIndiaIndonesiaIran, Islamic Rep.IraqIrelandIsraelItalyJamaicaJapanJordanKazakhstanKenyaKiribatiKorea, Dem. People’s Rep.Korea, Rep.KuwaitKyrgyz RepublicLao PDRLate-demographic dividendLatin America & Caribbean Latin America & Caribbean (excluding high income)Latin America & the Caribbean (IDA & IBRD countries)LatviaLeast developed countries: UN classificationLebanonLesothoLibyaLiechtensteinLithuaniaLow & middle incomeLow incomeLower middle incomeLuxembourgMacedonia, FYRMadagascarMalawiMalaysiaMaliMaltaMauritaniaMauritiusMexicoMiddle East & North AfricaMiddle East & North Africa (excluding high income)Middle East & North Africa (IDA & IBRD countries)Middle incomeMoldovaMongoliaMoroccoMozambiqueMyanmarNepalNetherlandsNew CaledoniaNew ZealandNicaraguaNigerNigeriaNorth AmericaNorthern Mariana IslandsNorwayOECD membersOmanOther small statesPakistanPanamaPapua New GuineaParaguayPeruPhilippinesPolandPortugalPost-demographic dividendPre-demographic dividendPuerto RicoQatarRomaniaRussian FederationRwandaSamoaSao Tome and PrincipeSaudi ArabiaSenegalSerbiaSeychellesSierra LeoneSlovak RepublicSloveniaSmall statesSolomon IslandsSomaliaSouth AfricaSouth AsiaSouth Asia (IDA & IBRD)SpainSri LankaSt. Kitts and NevisSt. LuciaSt. Vincent and the GrenadinesSub-Saharan Africa Sub-Saharan Africa (excluding high income)Sub-Saharan Africa (IDA & IBRD countries)SudanSurinameSwazilandSwedenSwitzerlandSyrian Arab RepublicTajikistanTanzaniaThailandTimor-LesteTogoTongaTrinidad and TobagoTunisiaTurkeyTurkmenistanUgandaUkraineUnited Arab EmiratesUnited KingdomUnited StatesUpper middle incomeUruguayVanuatuVenezuela, RBVietnamVirgin Islands (U.S.)West Bank and GazaWorldYemen, Rep.ZambiaZimbabwe Linha do tempo:
Nesta escala de tempo está apresentado um gráfico de 1962 ano até 2009 ano Bulgaria. Dados de 1961 ano ausente. O número de observações reais por data: 48.
Fonte (nome):
Indicadores de desenvolvimento mundial
Fonte (organização):
Food and Agriculture Organization, electronic files and web site.
Categorias:
Agriculture & Rural Development
Foi atualizado:
23 abr 2017 ano
Indicadores de alterações dos valores ao longo dos anos
Mínimo:
65.148
1 jan 1962 ano
Máximo:
172.291
1 jan 2009 ano
Na data de observação
Valor
Mudança absoluta
A alteração em relação ao valor anterior
1 jan 1962 ano
65.148
+65.148
0.0%
1 jan 1963 ano
74.023
+8.874
13.62%
1 jan 1964 ano
83.533
+9.51
12.85%
1 jan 1965 ano
93.031
+9.498
11.37%
1 jan 1966 ano
100.888
+7.857
8.45%
1 jan 1967 ano
108.166
+7.278
7.21%
1 jan 1968 ano
113.102
+4.936
4.56%
1 jan 1969 ano
122.263
+9.161
8.1%
1 jan 1970 ano
127.477
+5.214
4.26%
1 jan 1971 ano
129.45
+1.972
1.55%
1 jan 1972 ano
133.761
+4.311
3.33%
1 jan 1973 ano
140.504
+6.743
5.04%
1 jan 1974 ano
145.631
+5.127
3.65%
1 jan 1975 ano
151.293
+5.662
3.89%
1 jan 1976 ano
163.48
+12.187
8.05%
1 jan 1977 ano
166.277
+2.797
1.71%
1 jan 1978 ano
165.151
-1.126
-0.68%
1 jan 1979 ano
164.078
-1.073
-0.65%
1 jan 1980 ano
162.805
-1.273
-0.78%
1 jan 1981 ano
161.923
-0.882
-0.54%
1 jan 1982 ano
158.269
-3.654
-2.26%
1 jan 1983 ano
156.061
-2.208
-1.4%
1 jan 1984 ano
152.81
-3.251
-2.08%
1 jan 1985 ano
148.936
-3.873
-2.53%
1 jan 1986 ano
144.78
-4.157
-2.79%
1 jan 1987 ano
141.87
-2.91
-2.01%
1 jan 1988 ano
140.235
-1.634
-1.15%
1 jan 1989 ano
139.789
-0.446
-0.32%
1 jan 1990 ano
139.431
-0.358
-0.26%
1 jan 1991 ano
135.827
-3.604
-2.58%
1 jan 1992 ano
130.432
-5.395
-3.97%
1 jan 1993 ano
117.151
-13.281
-10.18%
1 jan 1994 ano
92.127
-25.024
-21.36%
1 jan 1995 ano
94.351
+2.225
2.42%
1 jan 1996 ano
95.798
+1.446
1.53%
1 jan 1997 ano
92.434
-3.364
-3.51%
1 jan 1998 ano
91.671
-0.763
-0.83%
1 jan 1999 ano
113.122
+21.452
23.4%
1 jan 2000 ano
114.304
+1.182
1.04%
1 jan 2001 ano
98.437
-15.867
-13.88%
1 jan 2002 ano
94.035
-4.402
-4.47%
1 jan 2003 ano
95.592
+1.556
1.66%
1 jan 2004 ano
95.113
-0.479
-0.5%
1 jan 2005 ano
93.456
-1.657
-1.74%
1 jan 2006 ano
114.251
+20.795
22.25%
1 jan 2007 ano
132.449
+18.198
15.93%
1 jan 2008 ano
149.9
+17.45
13.18%
1 jan 2009 ano
172.291
+22.391
14.94%
Classificação de países por estatísticas atuais por anos


Comentários: