29
/pt/
pt
AIzaSyAYiBZKx7MnpbEhh9jyipgxe19OcubqV5w
April 1, 2024
195155
Mexico
MEX
true
2
1
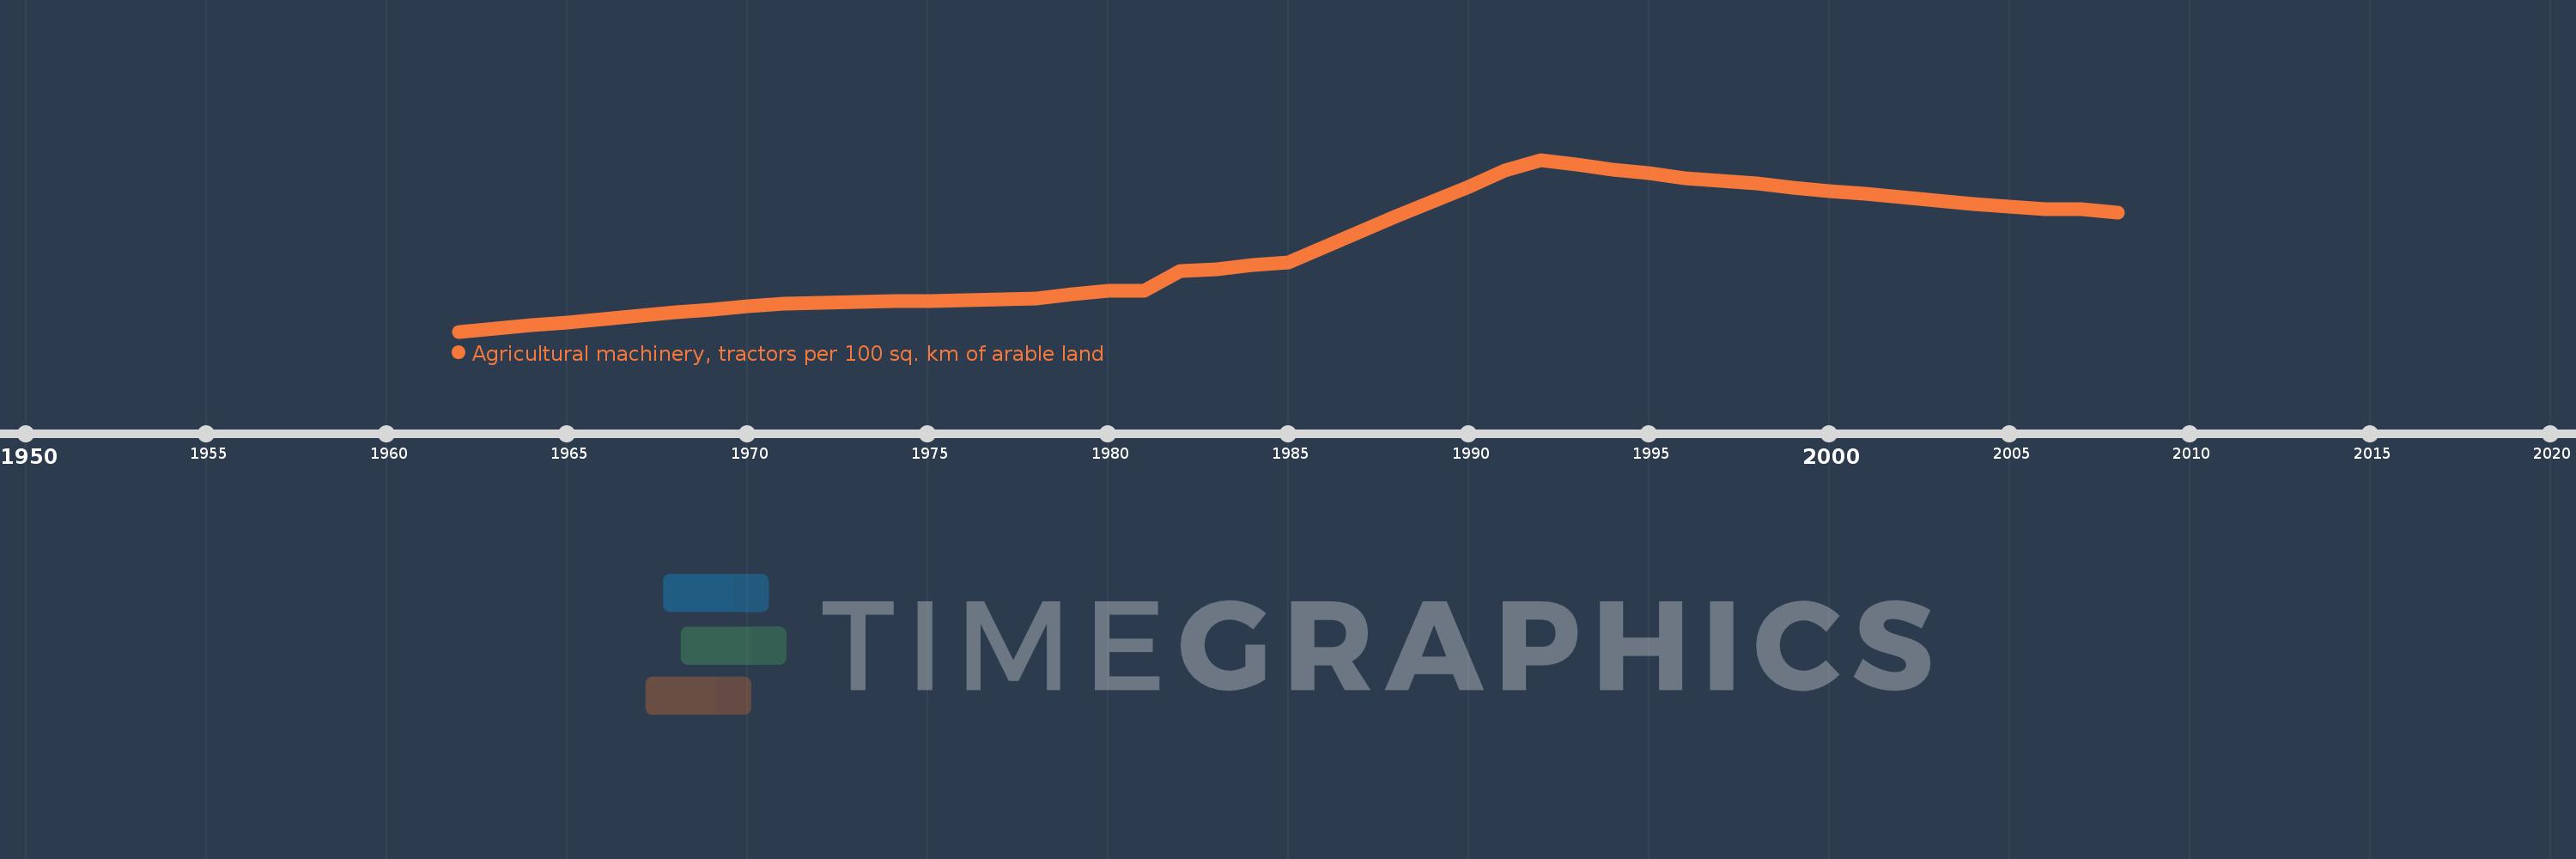
Agricultural machinery, tractors per 100 sq. km of arable land
2008,2007,2006,2005,2004,2003,2002,2001,2000,1999,1998,1997,1996,1995,1994,1993,1992,1991,1990,1989,1988,1987,1986,1985,1984,1983,1982,1981,1980,1979,1978,1977,1976,1975,1974,1973,1972,1971,1970,1969,1968,1967,1966,1965,1964,1963,1962
Estas estatísticas em outros países:
AfghanistanAlbaniaAlgeriaAmerican SamoaAndorraAngolaAntigua and BarbudaArab WorldArgentinaArmeniaAustraliaAustriaAzerbaijanBahamas, TheBahrainBangladeshBarbadosBelarusBelgiumBelizeBeninBermudaBhutanBoliviaBosnia and HerzegovinaBotswanaBrazilBritish Virgin IslandsBrunei DarussalamBulgariaBurkina FasoBurundiCabo VerdeCambodiaCameroonCanadaCaribbean small statesCentral African RepublicCentral Europe and the BalticsChadChileChinaColombiaCongo, Dem. Rep.Congo, Rep.Costa RicaCote d'IvoireCroatiaCubaCyprusCzech RepublicDenmarkDjiboutiDominicaDominican RepublicEarly-demographic dividendEast Asia & PacificEast Asia & Pacific (excluding high income)East Asia & Pacific (IDA & IBRD countries)EcuadorEgypt, Arab Rep.El SalvadorEritreaEstoniaEuro areaEurope & Central AsiaEurope & Central Asia (excluding high income)Europe & Central Asia (IDA & IBRD countries)European UnionFijiFinlandFragile and conflict affected situationsFranceFrench PolynesiaGambia, TheGeorgiaGermanyGhanaGreeceGrenadaGuamGuatemalaGuineaGuinea-BissauGuyanaHaitiHeavily indebted poor countries (HIPC)High incomeHondurasHungaryIBRD onlyIcelandIDA & IBRD totalIDA blendIDA onlyIDA totalIndiaIndonesiaIran, Islamic Rep.IraqIrelandIsraelItalyJamaicaJapanJordanKazakhstanKenyaKiribatiKorea, Dem. People’s Rep.Korea, Rep.KuwaitKyrgyz RepublicLao PDRLate-demographic dividendLatin America & Caribbean Latin America & Caribbean (excluding high income)Latin America & the Caribbean (IDA & IBRD countries)LatviaLeast developed countries: UN classificationLebanonLesothoLibyaLiechtensteinLithuaniaLow & middle incomeLow incomeLower middle incomeLuxembourgMacedonia, FYRMadagascarMalawiMalaysiaMaliMaltaMauritaniaMauritiusMexicoMiddle East & North AfricaMiddle East & North Africa (excluding high income)Middle East & North Africa (IDA & IBRD countries)Middle incomeMoldovaMongoliaMoroccoMozambiqueMyanmarNepalNetherlandsNew CaledoniaNew ZealandNicaraguaNigerNigeriaNorth AmericaNorthern Mariana IslandsNorwayOECD membersOmanOther small statesPakistanPanamaPapua New GuineaParaguayPeruPhilippinesPolandPortugalPost-demographic dividendPre-demographic dividendPuerto RicoQatarRomaniaRussian FederationRwandaSamoaSao Tome and PrincipeSaudi ArabiaSenegalSerbiaSeychellesSierra LeoneSlovak RepublicSloveniaSmall statesSolomon IslandsSomaliaSouth AfricaSouth AsiaSouth Asia (IDA & IBRD)SpainSri LankaSt. Kitts and NevisSt. LuciaSt. Vincent and the GrenadinesSub-Saharan Africa Sub-Saharan Africa (excluding high income)Sub-Saharan Africa (IDA & IBRD countries)SudanSurinameSwazilandSwedenSwitzerlandSyrian Arab RepublicTajikistanTanzaniaThailandTimor-LesteTogoTongaTrinidad and TobagoTunisiaTurkeyTurkmenistanUgandaUkraineUnited Arab EmiratesUnited KingdomUnited StatesUpper middle incomeUruguayVanuatuVenezuela, RBVietnamVirgin Islands (U.S.)West Bank and GazaWorldYemen, Rep.ZambiaZimbabwe Linha do tempo:
Nesta escala de tempo está apresentado um gráfico de 1962 ano até 2008 ano Mexico. Dados de 1961 ano ausente. O número de observações reais por data: 47.
Fonte (nome):
Indicadores de desenvolvimento mundial
Fonte (organização):
Food and Agriculture Organization, electronic files and web site.
Categorias:
Agriculture & Rural Development
Foi atualizado:
23 abr 2017 ano
Indicadores de alterações dos valores ao longo dos anos
Mínimo:
24.978
1 jan 1962 ano
Máximo:
129.78
1 jan 1992 ano
Na data de observação
Valor
Mudança absoluta
A alteração em relação ao valor anterior
1 jan 1962 ano
24.978
+24.978
0.0%
1 jan 1963 ano
26.858
+1.88
7.53%
1 jan 1964 ano
28.751
+1.893
7.05%
1 jan 1965 ano
30.658
+1.907
6.63%
1 jan 1966 ano
32.579
+1.921
6.27%
1 jan 1967 ano
34.514
+1.935
5.94%
1 jan 1968 ano
36.548
+2.034
5.89%
1 jan 1969 ano
38.398
+1.85
5.06%
1 jan 1970 ano
40.239
+1.841
4.79%
1 jan 1971 ano
42.122
+1.883
4.68%
1 jan 1972 ano
42.53
+0.408
0.97%
1 jan 1973 ano
42.961
+0.431
1.01%
1 jan 1974 ano
43.342
+0.381
0.89%
1 jan 1975 ano
43.784
+0.441
1.02%
1 jan 1976 ano
44.181
+0.397
0.91%
1 jan 1977 ano
44.528
+0.348
0.79%
1 jan 1978 ano
44.961
+0.432
0.97%
1 jan 1979 ano
47.607
+2.647
5.89%
1 jan 1980 ano
49.847
+2.24
4.7%
1 jan 1981 ano
50.025
+0.178
0.36%
1 jan 1982 ano
62.073
+12.048
24.08%
1 jan 1983 ano
63.136
+1.063
1.71%
1 jan 1984 ano
65.831
+2.695
4.27%
1 jan 1985 ano
66.989
+1.159
1.76%
1 jan 1986 ano
76.64
+9.651
14.41%
1 jan 1987 ano
86.017
+9.378
12.24%
1 jan 1988 ano
95.237
+9.22
10.72%
1 jan 1989 ano
104.603
+9.365
9.83%
1 jan 1990 ano
113.237
+8.634
8.25%
1 jan 1991 ano
123.457
+10.22
9.03%
1 jan 1992 ano
129.78
+6.324
5.12%
1 jan 1993 ano
126.995
-2.785
-2.15%
1 jan 1994 ano
123.993
-3.002
-2.36%
1 jan 1995 ano
121.525
-2.468
-1.99%
1 jan 1996 ano
118.602
-2.923
-2.4%
1 jan 1997 ano
117.115
-1.488
-1.25%
1 jan 1998 ano
115.153
-1.962
-1.68%
1 jan 1999 ano
112.74
-2.413
-2.1%
1 jan 2000 ano
110.786
-1.954
-1.73%
1 jan 2001 ano
108.831
-1.955
-1.76%
1 jan 2002 ano
106.877
-1.954
-1.8%
1 jan 2003 ano
104.923
-1.954
-1.83%
1 jan 2004 ano
102.969
-1.954
-1.86%
1 jan 2005 ano
101.014
-1.954
-1.9%
1 jan 2006 ano
99.456
-1.558
-1.54%
1 jan 2007 ano
99.484
+0.028
0.03%
1 jan 2008 ano
97.669
-1.815
-1.82%
Classificação de países por estatísticas atuais por anos


Comentários: