29
/pt/
pt
AIzaSyAYiBZKx7MnpbEhh9jyipgxe19OcubqV5w
April 1, 2024
253863
Suriname
SUR
true
2
1
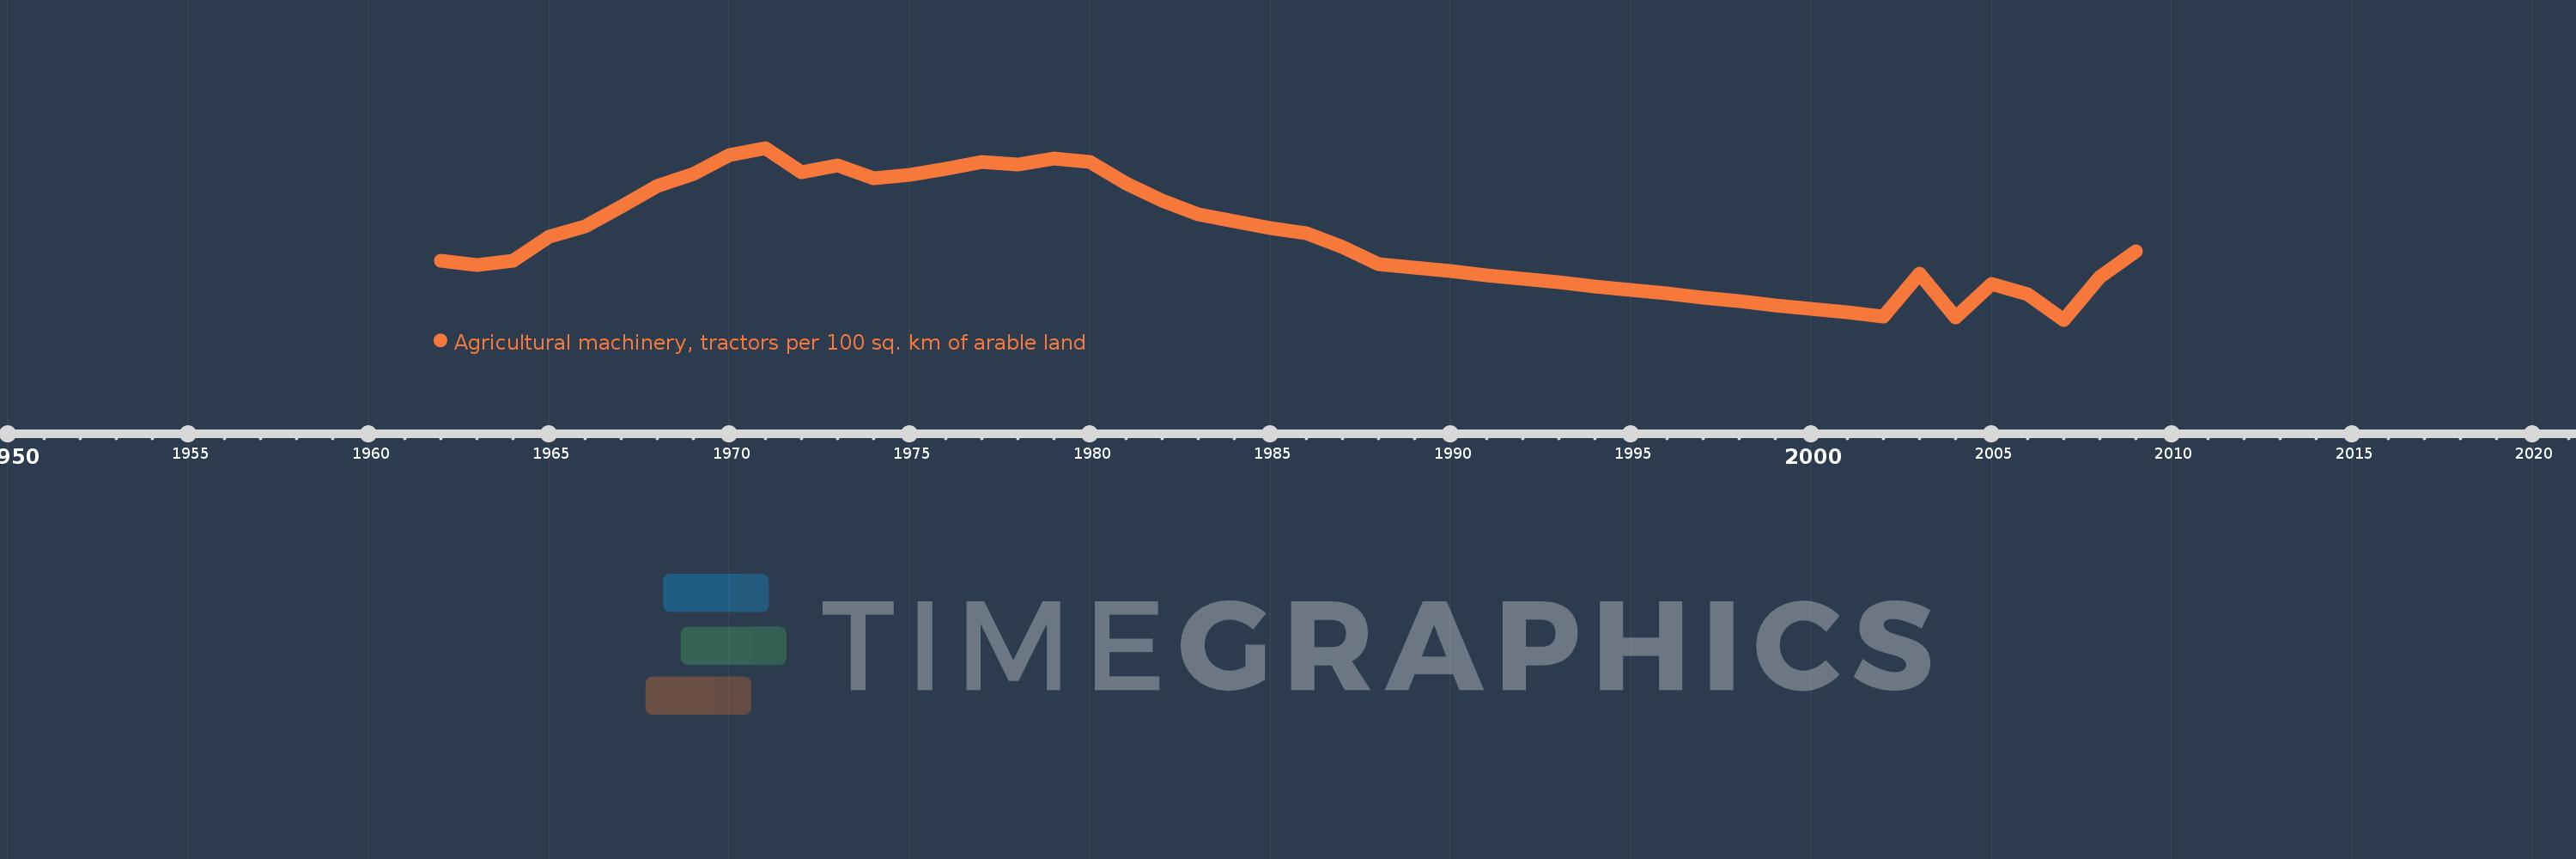
Agricultural machinery, tractors per 100 sq. km of arable land
2009,2008,2007,2006,2005,2004,2003,2002,2001,2000,1999,1998,1997,1996,1995,1994,1993,1992,1991,1990,1989,1988,1987,1986,1985,1984,1983,1982,1981,1980,1979,1978,1977,1976,1975,1974,1973,1972,1971,1970,1969,1968,1967,1966,1965,1964,1963,1962
Estas estatísticas em outros países:
AfghanistanAlbaniaAlgeriaAmerican SamoaAndorraAngolaAntigua and BarbudaArab WorldArgentinaArmeniaAustraliaAustriaAzerbaijanBahamas, TheBahrainBangladeshBarbadosBelarusBelgiumBelizeBeninBermudaBhutanBoliviaBosnia and HerzegovinaBotswanaBrazilBritish Virgin IslandsBrunei DarussalamBulgariaBurkina FasoBurundiCabo VerdeCambodiaCameroonCanadaCaribbean small statesCentral African RepublicCentral Europe and the BalticsChadChileChinaColombiaCongo, Dem. Rep.Congo, Rep.Costa RicaCote d'IvoireCroatiaCubaCyprusCzech RepublicDenmarkDjiboutiDominicaDominican RepublicEarly-demographic dividendEast Asia & PacificEast Asia & Pacific (excluding high income)East Asia & Pacific (IDA & IBRD countries)EcuadorEgypt, Arab Rep.El SalvadorEritreaEstoniaEuro areaEurope & Central AsiaEurope & Central Asia (excluding high income)Europe & Central Asia (IDA & IBRD countries)European UnionFijiFinlandFragile and conflict affected situationsFranceFrench PolynesiaGambia, TheGeorgiaGermanyGhanaGreeceGrenadaGuamGuatemalaGuineaGuinea-BissauGuyanaHaitiHeavily indebted poor countries (HIPC)High incomeHondurasHungaryIBRD onlyIcelandIDA & IBRD totalIDA blendIDA onlyIDA totalIndiaIndonesiaIran, Islamic Rep.IraqIrelandIsraelItalyJamaicaJapanJordanKazakhstanKenyaKiribatiKorea, Dem. People’s Rep.Korea, Rep.KuwaitKyrgyz RepublicLao PDRLate-demographic dividendLatin America & Caribbean Latin America & Caribbean (excluding high income)Latin America & the Caribbean (IDA & IBRD countries)LatviaLeast developed countries: UN classificationLebanonLesothoLibyaLiechtensteinLithuaniaLow & middle incomeLow incomeLower middle incomeLuxembourgMacedonia, FYRMadagascarMalawiMalaysiaMaliMaltaMauritaniaMauritiusMexicoMiddle East & North AfricaMiddle East & North Africa (excluding high income)Middle East & North Africa (IDA & IBRD countries)Middle incomeMoldovaMongoliaMoroccoMozambiqueMyanmarNepalNetherlandsNew CaledoniaNew ZealandNicaraguaNigerNigeriaNorth AmericaNorthern Mariana IslandsNorwayOECD membersOmanOther small statesPakistanPanamaPapua New GuineaParaguayPeruPhilippinesPolandPortugalPost-demographic dividendPre-demographic dividendPuerto RicoQatarRomaniaRussian FederationRwandaSamoaSao Tome and PrincipeSaudi ArabiaSenegalSerbiaSeychellesSierra LeoneSlovak RepublicSloveniaSmall statesSolomon IslandsSomaliaSouth AfricaSouth AsiaSouth Asia (IDA & IBRD)SpainSri LankaSt. Kitts and NevisSt. LuciaSt. Vincent and the GrenadinesSub-Saharan Africa Sub-Saharan Africa (excluding high income)Sub-Saharan Africa (IDA & IBRD countries)SudanSurinameSwazilandSwedenSwitzerlandSyrian Arab RepublicTajikistanTanzaniaThailandTimor-LesteTogoTongaTrinidad and TobagoTunisiaTurkeyTurkmenistanUgandaUkraineUnited Arab EmiratesUnited KingdomUnited StatesUpper middle incomeUruguayVanuatuVenezuela, RBVietnamVirgin Islands (U.S.)West Bank and GazaWorldYemen, Rep.ZambiaZimbabwe Linha do tempo:
Nesta escala de tempo está apresentado um gráfico de 1962 ano até 2009 ano Suriname. Dados de 1961 ano ausente. O número de observações reais por data: 48.
Fonte (nome):
Indicadores de desenvolvimento mundial
Fonte (organização):
Food and Agriculture Organization, electronic files and web site.
Categorias:
Agriculture & Rural Development
Foi atualizado:
23 abr 2017 ano
Indicadores de alterações dos valores ao longo dos anos
Mínimo:
154.694
1 jan 2007 ano
Máximo:
306.667
1 jan 1971 ano
Na data de observação
Valor
Mudança absoluta
A alteração em relação ao valor anterior
1 jan 1962 ano
207.143
+207.143
0.0%
1 jan 1963 ano
203.448
-3.695
-1.78%
1 jan 1964 ano
206.897
+3.448
1.69%
1 jan 1965 ano
228.125
+21.228
10.26%
1 jan 1966 ano
237.5
+9.375
4.11%
1 jan 1967 ano
254.839
+17.339
7.3%
1 jan 1968 ano
273.333
+18.495
7.26%
1 jan 1969 ano
283.333
+10.0
3.66%
1 jan 1970 ano
300.333
+17.0
6.0%
1 jan 1971 ano
306.667
+6.333
2.11%
1 jan 1972 ano
284.848
-21.818
-7.11%
1 jan 1973 ano
290.909
+6.061
2.13%
1 jan 1974 ano
280.0
-10.909
-3.75%
1 jan 1975 ano
282.857
+2.857
1.02%
1 jan 1976 ano
288.571
+5.714
2.02%
1 jan 1977 ano
294.286
+5.714
1.98%
1 jan 1978 ano
291.667
-2.619
-0.89%
1 jan 1979 ano
297.222
+5.556
1.9%
1 jan 1980 ano
294.595
-2.628
-0.88%
1 jan 1981 ano
275.0
-19.595
-6.65%
1 jan 1982 ano
260.465
-14.535
-5.29%
1 jan 1983 ano
247.826
-12.639
-4.85%
1 jan 1984 ano
241.667
-6.159
-2.49%
1 jan 1985 ano
236.0
-5.667
-2.34%
1 jan 1986 ano
231.154
-4.846
-2.05%
1 jan 1987 ano
219.074
-12.08
-5.23%
1 jan 1988 ano
204.211
-14.864
-6.78%
1 jan 1989 ano
200.877
-3.333
-1.63%
1 jan 1990 ano
197.544
-3.333
-1.66%
1 jan 1991 ano
194.211
-3.333
-1.69%
1 jan 1992 ano
190.877
-3.333
-1.72%
1 jan 1993 ano
187.544
-3.333
-1.75%
1 jan 1994 ano
184.211
-3.333
-1.78%
1 jan 1995 ano
181.053
-3.158
-1.71%
1 jan 1996 ano
177.719
-3.333
-1.84%
1 jan 1997 ano
174.386
-3.333
-1.88%
1 jan 1998 ano
171.053
-3.333
-1.91%
1 jan 1999 ano
167.719
-3.333
-1.95%
1 jan 2000 ano
164.386
-3.333
-1.99%
1 jan 2001 ano
161.053
-3.333
-2.03%
1 jan 2002 ano
157.719
-3.333
-2.07%
1 jan 2003 ano
195.556
+37.836
23.99%
1 jan 2004 ano
156.545
-39.01
-19.95%
1 jan 2005 ano
186.415
+29.87
19.08%
1 jan 2006 ano
177.347
-9.068
-4.86%
1 jan 2007 ano
154.694
-22.653
-12.77%
1 jan 2008 ano
192.391
+37.697
24.37%
1 jan 2009 ano
215.532
+23.141
12.03%
Classificação de países por estatísticas atuais por anos


Comentários: