29
/pt/
pt
AIzaSyAYiBZKx7MnpbEhh9jyipgxe19OcubqV5w
April 1, 2024
276363
United States
USA
true
2
1
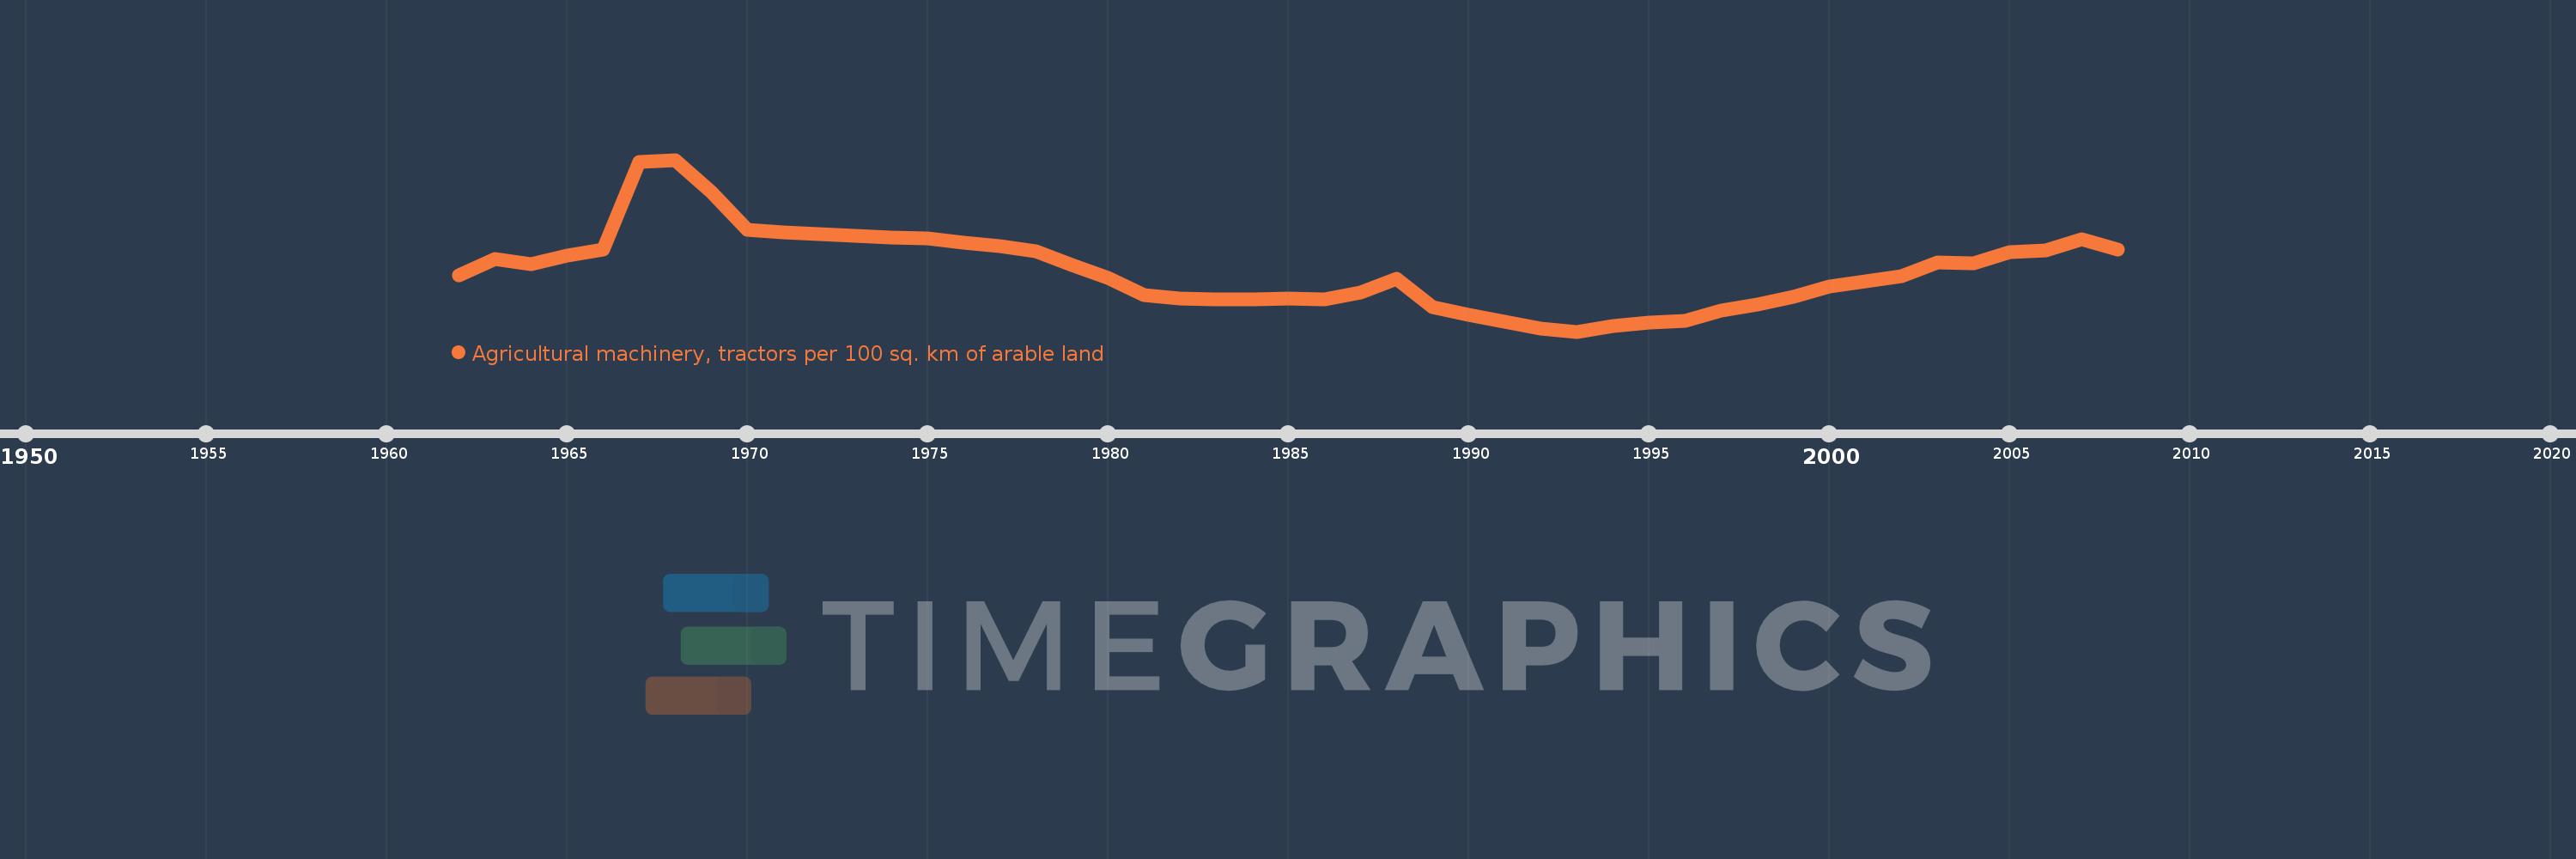
Agricultural machinery, tractors per 100 sq. km of arable land
2008,2007,2006,2005,2004,2003,2002,2001,2000,1999,1998,1997,1996,1995,1994,1993,1992,1991,1990,1989,1988,1987,1986,1985,1984,1983,1982,1981,1980,1979,1978,1977,1976,1975,1974,1973,1972,1971,1970,1969,1968,1967,1966,1965,1964,1963,1962
Estas estatísticas em outros países:
AfghanistanAlbaniaAlgeriaAmerican SamoaAndorraAngolaAntigua and BarbudaArab WorldArgentinaArmeniaAustraliaAustriaAzerbaijanBahamas, TheBahrainBangladeshBarbadosBelarusBelgiumBelizeBeninBermudaBhutanBoliviaBosnia and HerzegovinaBotswanaBrazilBritish Virgin IslandsBrunei DarussalamBulgariaBurkina FasoBurundiCabo VerdeCambodiaCameroonCanadaCaribbean small statesCentral African RepublicCentral Europe and the BalticsChadChileChinaColombiaCongo, Dem. Rep.Congo, Rep.Costa RicaCote d'IvoireCroatiaCubaCyprusCzech RepublicDenmarkDjiboutiDominicaDominican RepublicEarly-demographic dividendEast Asia & PacificEast Asia & Pacific (excluding high income)East Asia & Pacific (IDA & IBRD countries)EcuadorEgypt, Arab Rep.El SalvadorEritreaEstoniaEuro areaEurope & Central AsiaEurope & Central Asia (excluding high income)Europe & Central Asia (IDA & IBRD countries)European UnionFijiFinlandFragile and conflict affected situationsFranceFrench PolynesiaGambia, TheGeorgiaGermanyGhanaGreeceGrenadaGuamGuatemalaGuineaGuinea-BissauGuyanaHaitiHeavily indebted poor countries (HIPC)High incomeHondurasHungaryIBRD onlyIcelandIDA & IBRD totalIDA blendIDA onlyIDA totalIndiaIndonesiaIran, Islamic Rep.IraqIrelandIsraelItalyJamaicaJapanJordanKazakhstanKenyaKiribatiKorea, Dem. People’s Rep.Korea, Rep.KuwaitKyrgyz RepublicLao PDRLate-demographic dividendLatin America & Caribbean Latin America & Caribbean (excluding high income)Latin America & the Caribbean (IDA & IBRD countries)LatviaLeast developed countries: UN classificationLebanonLesothoLibyaLiechtensteinLithuaniaLow & middle incomeLow incomeLower middle incomeLuxembourgMacedonia, FYRMadagascarMalawiMalaysiaMaliMaltaMauritaniaMauritiusMexicoMiddle East & North AfricaMiddle East & North Africa (excluding high income)Middle East & North Africa (IDA & IBRD countries)Middle incomeMoldovaMongoliaMoroccoMozambiqueMyanmarNepalNetherlandsNew CaledoniaNew ZealandNicaraguaNigerNigeriaNorth AmericaNorthern Mariana IslandsNorwayOECD membersOmanOther small statesPakistanPanamaPapua New GuineaParaguayPeruPhilippinesPolandPortugalPost-demographic dividendPre-demographic dividendPuerto RicoQatarRomaniaRussian FederationRwandaSamoaSao Tome and PrincipeSaudi ArabiaSenegalSerbiaSeychellesSierra LeoneSlovak RepublicSloveniaSmall statesSolomon IslandsSomaliaSouth AfricaSouth AsiaSouth Asia (IDA & IBRD)SpainSri LankaSt. Kitts and NevisSt. LuciaSt. Vincent and the GrenadinesSub-Saharan Africa Sub-Saharan Africa (excluding high income)Sub-Saharan Africa (IDA & IBRD countries)SudanSurinameSwazilandSwedenSwitzerlandSyrian Arab RepublicTajikistanTanzaniaThailandTimor-LesteTogoTongaTrinidad and TobagoTunisiaTurkeyTurkmenistanUgandaUkraineUnited Arab EmiratesUnited KingdomUnited StatesUpper middle incomeUruguayVanuatuVenezuela, RBVietnamVirgin Islands (U.S.)West Bank and GazaWorldYemen, Rep.ZambiaZimbabwe Linha do tempo:
Nesta escala de tempo está apresentado um gráfico de 1962 ano até 2008 ano United States. Dados de 1961 ano ausente. O número de observações reais por data: 47.
Fonte (nome):
Indicadores de desenvolvimento mundial
Fonte (organização):
Food and Agriculture Organization, electronic files and web site.
Categorias:
Agriculture & Rural Development
Foi atualizado:
23 abr 2017 ano
Indicadores de alterações dos valores ao longo dos anos
Mínimo:
233.861
1 jan 1993 ano
Máximo:
312.344
1 jan 1968 ano
Na data de observação
Valor
Mudança absoluta
A alteração em relação ao valor anterior
1 jan 1962 ano
259.647
+259.647
0.0%
1 jan 1963 ano
267.088
+7.441
2.87%
1 jan 1964 ano
264.793
-2.295
-0.86%
1 jan 1965 ano
268.759
+3.966
1.5%
1 jan 1966 ano
271.186
+2.427
0.9%
1 jan 1967 ano
311.317
+40.131
14.8%
1 jan 1968 ano
312.344
+1.027
0.33%
1 jan 1969 ano
297.79
-14.554
-4.66%
1 jan 1970 ano
280.326
-17.464
-5.86%
1 jan 1971 ano
279.227
-1.098
-0.39%
1 jan 1972 ano
278.25
-0.977
-0.35%
1 jan 1973 ano
277.533
-0.717
-0.26%
1 jan 1974 ano
276.931
-0.602
-0.22%
1 jan 1975 ano
276.449
-0.482
-0.17%
1 jan 1976 ano
274.572
-1.877
-0.68%
1 jan 1977 ano
272.963
-1.609
-0.59%
1 jan 1978 ano
270.702
-2.261
-0.83%
1 jan 1979 ano
264.311
-6.391
-2.36%
1 jan 1980 ano
258.536
-5.775
-2.18%
1 jan 1981 ano
250.377
-8.159
-3.16%
1 jan 1982 ano
248.841
-1.536
-0.61%
1 jan 1983 ano
248.662
-0.179
-0.07%
1 jan 1984 ano
248.768
+0.107
0.04%
1 jan 1985 ano
249.035
+0.266
0.11%
1 jan 1986 ano
248.715
-0.32
-0.13%
1 jan 1987 ano
251.911
+3.195
1.28%
1 jan 1988 ano
257.831
+5.92
2.35%
1 jan 1989 ano
244.882
-12.948
-5.02%
1 jan 1990 ano
241.624
-3.258
-1.33%
1 jan 1991 ano
238.41
-3.215
-1.33%
1 jan 1992 ano
235.13
-3.28
-1.38%
1 jan 1993 ano
233.861
-1.27
-0.54%
1 jan 1994 ano
236.28
+2.42
1.03%
1 jan 1995 ano
238.049
+1.769
0.75%
1 jan 1996 ano
238.899
+0.85
0.36%
1 jan 1997 ano
243.41
+4.511
1.89%
1 jan 1998 ano
246.083
+2.674
1.1%
1 jan 1999 ano
249.726
+3.642
1.48%
1 jan 2000 ano
254.275
+4.549
1.82%
1 jan 2001 ano
256.81
+2.535
1.0%
1 jan 2002 ano
259.298
+2.488
0.97%
1 jan 2003 ano
265.5
+6.202
2.39%
1 jan 2004 ano
265.215
-0.285
-0.11%
1 jan 2005 ano
270.056
+4.841
1.83%
1 jan 2006 ano
270.775
+0.719
0.27%
1 jan 2007 ano
276.136
+5.361
1.98%
1 jan 2008 ano
271.177
-4.959
-1.8%
Classificação de países por estatísticas atuais por anos


Comentários: