29
/pt/
pt
AIzaSyAYiBZKx7MnpbEhh9jyipgxe19OcubqV5w
April 1, 2024
105659
China
CHN
true
2
1
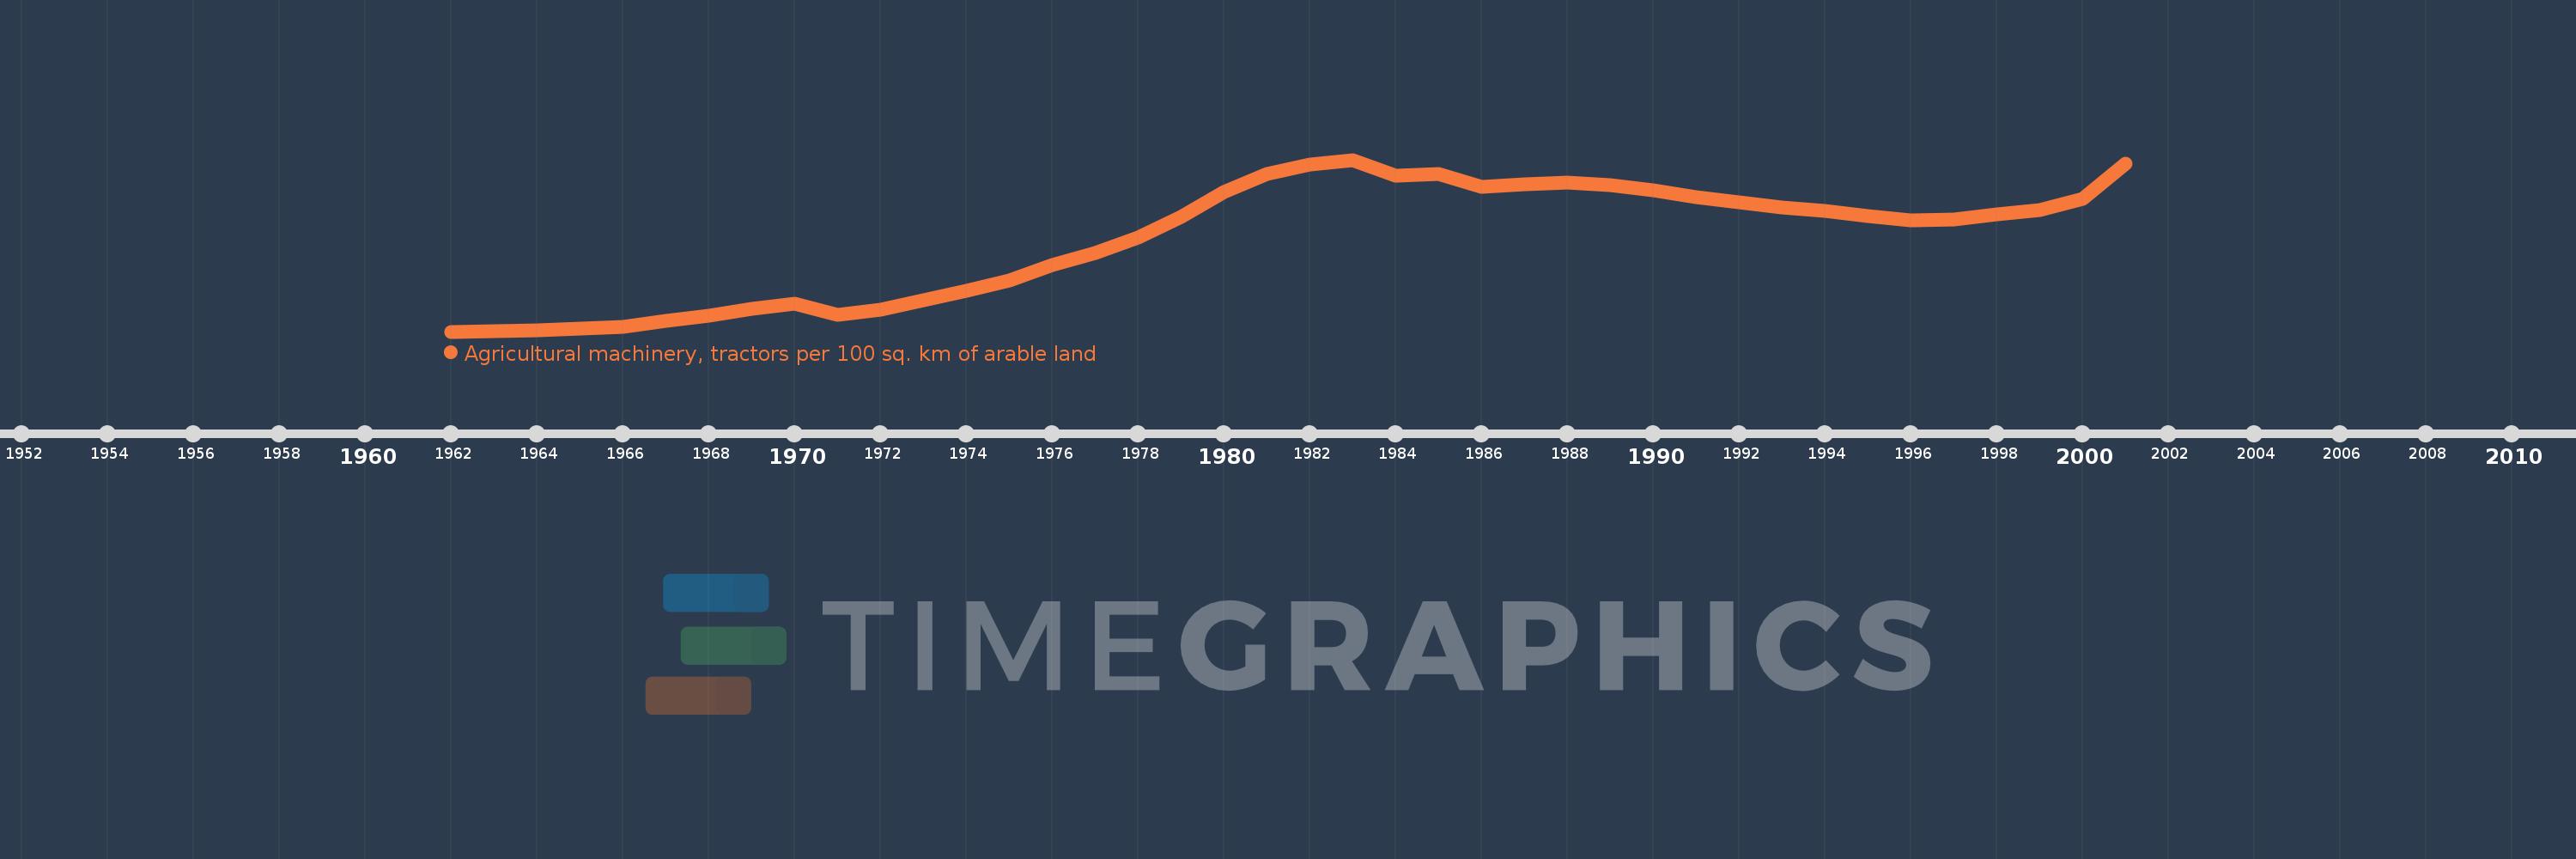
Agricultural machinery, tractors per 100 sq. km of arable land
2001,2000,1999,1998,1997,1996,1995,1994,1993,1992,1991,1990,1989,1988,1987,1986,1985,1984,1983,1982,1981,1980,1979,1978,1977,1976,1975,1974,1973,1972,1971,1970,1969,1968,1967,1966,1965,1964,1963,1962
Estas estatísticas em outros países:
AfghanistanAlbaniaAlgeriaAmerican SamoaAndorraAngolaAntigua and BarbudaArab WorldArgentinaArmeniaAustraliaAustriaAzerbaijanBahamas, TheBahrainBangladeshBarbadosBelarusBelgiumBelizeBeninBermudaBhutanBoliviaBosnia and HerzegovinaBotswanaBrazilBritish Virgin IslandsBrunei DarussalamBulgariaBurkina FasoBurundiCabo VerdeCambodiaCameroonCanadaCaribbean small statesCentral African RepublicCentral Europe and the BalticsChadChileChinaColombiaCongo, Dem. Rep.Congo, Rep.Costa RicaCote d'IvoireCroatiaCubaCyprusCzech RepublicDenmarkDjiboutiDominicaDominican RepublicEarly-demographic dividendEast Asia & PacificEast Asia & Pacific (excluding high income)East Asia & Pacific (IDA & IBRD countries)EcuadorEgypt, Arab Rep.El SalvadorEritreaEstoniaEuro areaEurope & Central AsiaEurope & Central Asia (excluding high income)Europe & Central Asia (IDA & IBRD countries)European UnionFijiFinlandFragile and conflict affected situationsFranceFrench PolynesiaGambia, TheGeorgiaGermanyGhanaGreeceGrenadaGuamGuatemalaGuineaGuinea-BissauGuyanaHaitiHeavily indebted poor countries (HIPC)High incomeHondurasHungaryIBRD onlyIcelandIDA & IBRD totalIDA blendIDA onlyIDA totalIndiaIndonesiaIran, Islamic Rep.IraqIrelandIsraelItalyJamaicaJapanJordanKazakhstanKenyaKiribatiKorea, Dem. People’s Rep.Korea, Rep.KuwaitKyrgyz RepublicLao PDRLate-demographic dividendLatin America & Caribbean Latin America & Caribbean (excluding high income)Latin America & the Caribbean (IDA & IBRD countries)LatviaLeast developed countries: UN classificationLebanonLesothoLibyaLiechtensteinLithuaniaLow & middle incomeLow incomeLower middle incomeLuxembourgMacedonia, FYRMadagascarMalawiMalaysiaMaliMaltaMauritaniaMauritiusMexicoMiddle East & North AfricaMiddle East & North Africa (excluding high income)Middle East & North Africa (IDA & IBRD countries)Middle incomeMoldovaMongoliaMoroccoMozambiqueMyanmarNepalNetherlandsNew CaledoniaNew ZealandNicaraguaNigerNigeriaNorth AmericaNorthern Mariana IslandsNorwayOECD membersOmanOther small statesPakistanPanamaPapua New GuineaParaguayPeruPhilippinesPolandPortugalPost-demographic dividendPre-demographic dividendPuerto RicoQatarRomaniaRussian FederationRwandaSamoaSao Tome and PrincipeSaudi ArabiaSenegalSerbiaSeychellesSierra LeoneSlovak RepublicSloveniaSmall statesSolomon IslandsSomaliaSouth AfricaSouth AsiaSouth Asia (IDA & IBRD)SpainSri LankaSt. Kitts and NevisSt. LuciaSt. Vincent and the GrenadinesSub-Saharan Africa Sub-Saharan Africa (excluding high income)Sub-Saharan Africa (IDA & IBRD countries)SudanSurinameSwazilandSwedenSwitzerlandSyrian Arab RepublicTajikistanTanzaniaThailandTimor-LesteTogoTongaTrinidad and TobagoTunisiaTurkeyTurkmenistanUgandaUkraineUnited Arab EmiratesUnited KingdomUnited StatesUpper middle incomeUruguayVanuatuVenezuela, RBVietnamVirgin Islands (U.S.)West Bank and GazaWorldYemen, Rep.ZambiaZimbabwe Linha do tempo:
Nesta escala de tempo está apresentado um gráfico de 1962 ano até 2001 ano China. Dados de 1961 ano ausente. O número de observações reais por data: 40.
Fonte (nome):
Indicadores de desenvolvimento mundial
Fonte (organização):
Food and Agriculture Organization, electronic files and web site.
Categorias:
Agriculture & Rural Development
Foi atualizado:
23 abr 2017 ano
Indicadores de alterações dos valores ao longo dos anos
Mínimo:
5.093
1 jan 1962 ano
Máximo:
83.668
1 jan 1983 ano
Na data de observação
Valor
Mudança absoluta
A alteração em relação ao valor anterior
1 jan 1962 ano
5.093
+5.093
0.0%
1 jan 1963 ano
5.37
+0.276
5.43%
1 jan 1964 ano
5.797
+0.428
7.97%
1 jan 1965 ano
6.454
+0.657
11.33%
1 jan 1966 ano
7.127
+0.673
10.42%
1 jan 1967 ano
9.846
+2.719
38.15%
1 jan 1968 ano
12.357
+2.511
25.5%
1 jan 1969 ano
15.402
+3.045
24.64%
1 jan 1970 ano
17.976
+2.574
16.71%
1 jan 1971 ano
12.636
-5.341
-29.71%
1 jan 1972 ano
15.184
+2.548
20.17%
1 jan 1973 ano
19.282
+4.098
26.99%
1 jan 1974 ano
23.863
+4.581
23.76%
1 jan 1975 ano
28.439
+4.576
19.18%
1 jan 1976 ano
35.464
+7.025
24.7%
1 jan 1977 ano
40.851
+5.387
15.19%
1 jan 1978 ano
48.103
+7.252
17.75%
1 jan 1979 ano
57.563
+9.46
19.67%
1 jan 1980 ano
68.872
+11.308
19.64%
1 jan 1981 ano
77.144
+8.272
12.01%
1 jan 1982 ano
81.689
+4.545
5.89%
1 jan 1983 ano
83.668
+1.979
2.42%
1 jan 1984 ano
76.216
-7.452
-8.91%
1 jan 1985 ano
77.01
+0.793
1.04%
1 jan 1986 ano
71.284
-5.725
-7.43%
1 jan 1987 ano
72.543
+1.259
1.77%
1 jan 1988 ano
73.279
+0.736
1.01%
1 jan 1989 ano
72.088
-1.191
-1.63%
1 jan 1990 ano
69.597
-2.491
-3.46%
1 jan 1991 ano
66.632
-2.965
-4.26%
1 jan 1992 ano
64.083
-2.55
-3.83%
1 jan 1993 ano
61.967
-2.116
-3.3%
1 jan 1994 ano
60.235
-1.732
-2.8%
1 jan 1995 ano
57.966
-2.269
-3.77%
1 jan 1996 ano
56.132
-1.834
-3.16%
1 jan 1997 ano
56.407
+0.275
0.49%
1 jan 1998 ano
58.531
+2.124
3.77%
1 jan 1999 ano
60.74
+2.208
3.77%
1 jan 2000 ano
65.973
+5.234
8.62%
1 jan 2001 ano
81.767
+15.793
23.94%
Classificação de países por estatísticas atuais por anos


Comentários: