29
/pt/
pt
AIzaSyAYiBZKx7MnpbEhh9jyipgxe19OcubqV5w
April 1, 2024
118630
Denmark
DNK
true
2
1
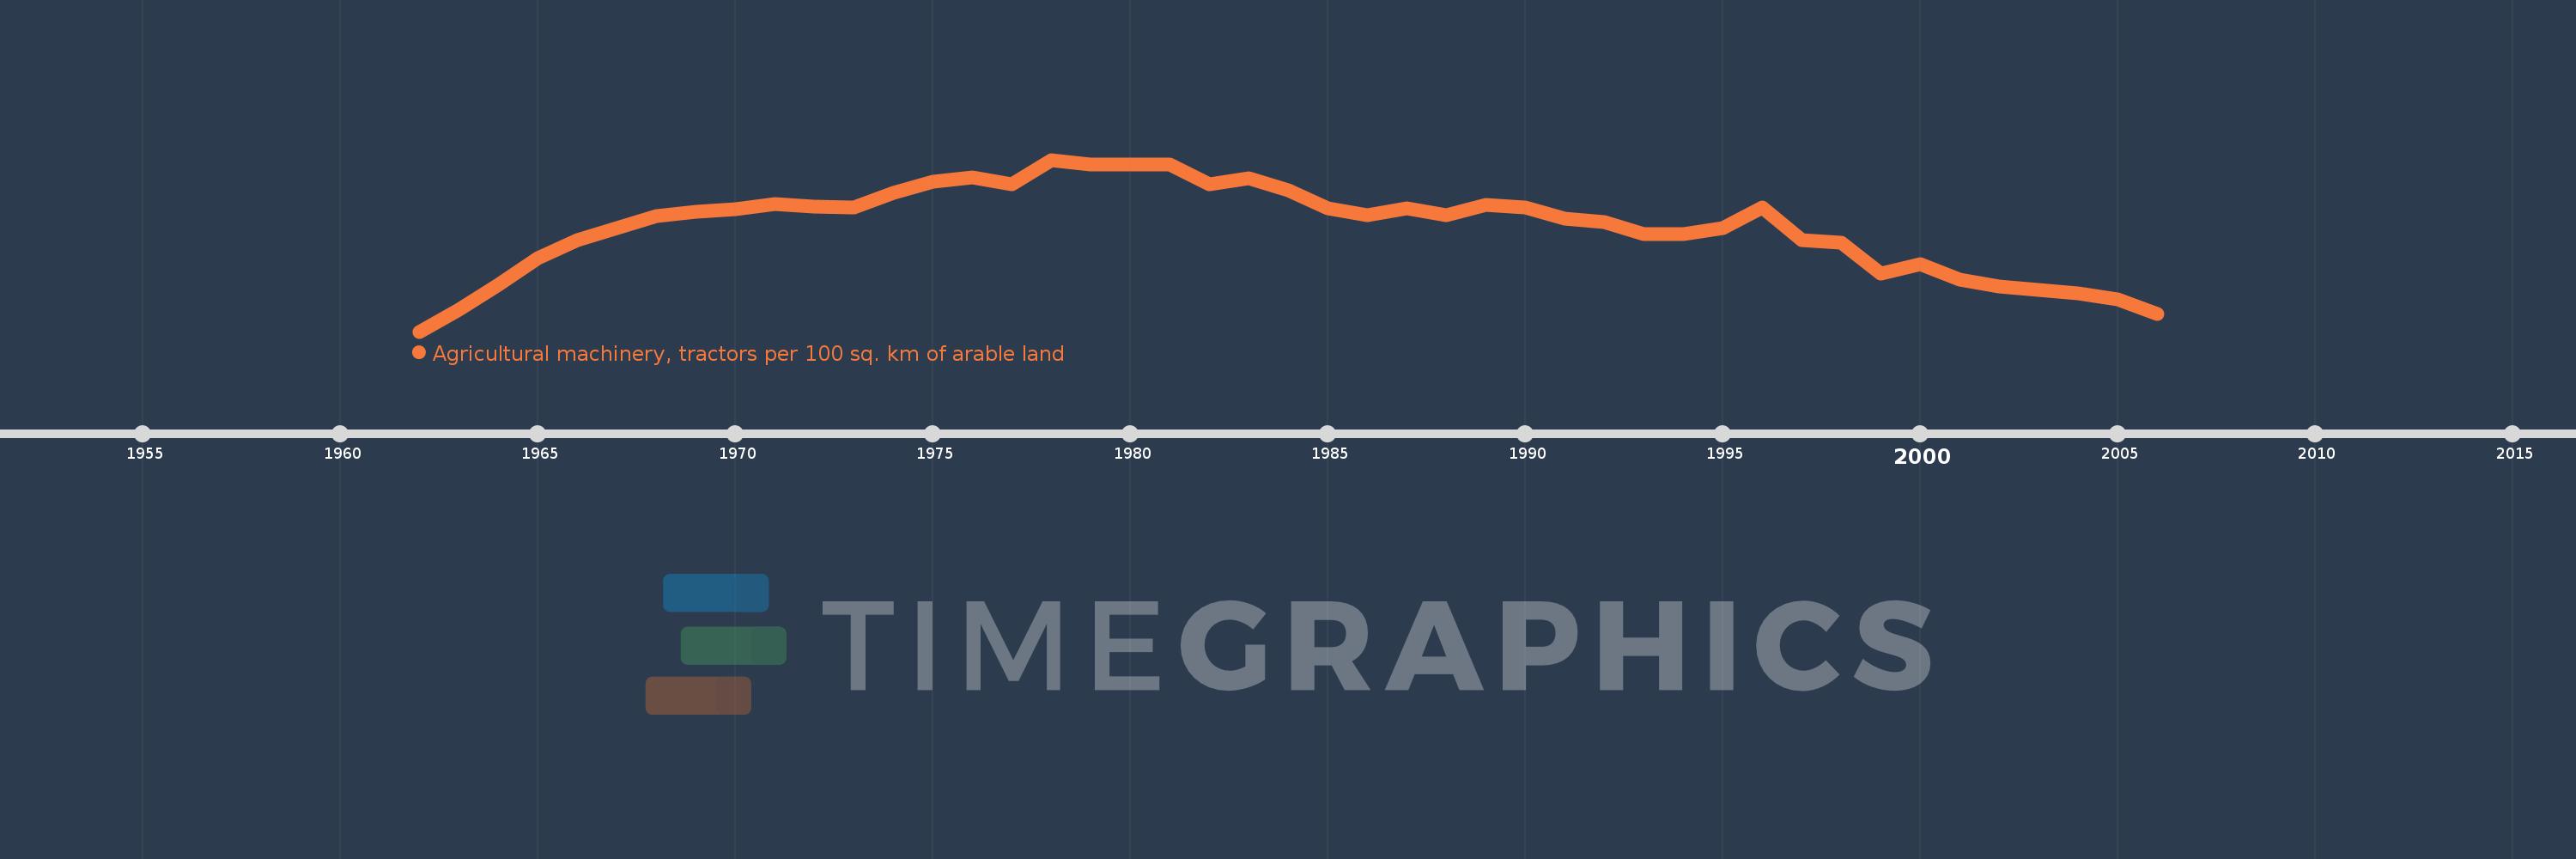
Agricultural machinery, tractors per 100 sq. km of arable land
2006,2005,2004,2003,2002,2001,2000,1999,1998,1997,1996,1995,1994,1993,1992,1991,1990,1989,1988,1987,1986,1985,1984,1983,1982,1981,1980,1979,1978,1977,1976,1975,1974,1973,1972,1971,1970,1969,1968,1967,1966,1965,1964,1963,1962
Estas estatísticas em outros países:
AfghanistanAlbaniaAlgeriaAmerican SamoaAndorraAngolaAntigua and BarbudaArab WorldArgentinaArmeniaAustraliaAustriaAzerbaijanBahamas, TheBahrainBangladeshBarbadosBelarusBelgiumBelizeBeninBermudaBhutanBoliviaBosnia and HerzegovinaBotswanaBrazilBritish Virgin IslandsBrunei DarussalamBulgariaBurkina FasoBurundiCabo VerdeCambodiaCameroonCanadaCaribbean small statesCentral African RepublicCentral Europe and the BalticsChadChileChinaColombiaCongo, Dem. Rep.Congo, Rep.Costa RicaCote d'IvoireCroatiaCubaCyprusCzech RepublicDenmarkDjiboutiDominicaDominican RepublicEarly-demographic dividendEast Asia & PacificEast Asia & Pacific (excluding high income)East Asia & Pacific (IDA & IBRD countries)EcuadorEgypt, Arab Rep.El SalvadorEritreaEstoniaEuro areaEurope & Central AsiaEurope & Central Asia (excluding high income)Europe & Central Asia (IDA & IBRD countries)European UnionFijiFinlandFragile and conflict affected situationsFranceFrench PolynesiaGambia, TheGeorgiaGermanyGhanaGreeceGrenadaGuamGuatemalaGuineaGuinea-BissauGuyanaHaitiHeavily indebted poor countries (HIPC)High incomeHondurasHungaryIBRD onlyIcelandIDA & IBRD totalIDA blendIDA onlyIDA totalIndiaIndonesiaIran, Islamic Rep.IraqIrelandIsraelItalyJamaicaJapanJordanKazakhstanKenyaKiribatiKorea, Dem. People’s Rep.Korea, Rep.KuwaitKyrgyz RepublicLao PDRLate-demographic dividendLatin America & Caribbean Latin America & Caribbean (excluding high income)Latin America & the Caribbean (IDA & IBRD countries)LatviaLeast developed countries: UN classificationLebanonLesothoLibyaLiechtensteinLithuaniaLow & middle incomeLow incomeLower middle incomeLuxembourgMacedonia, FYRMadagascarMalawiMalaysiaMaliMaltaMauritaniaMauritiusMexicoMiddle East & North AfricaMiddle East & North Africa (excluding high income)Middle East & North Africa (IDA & IBRD countries)Middle incomeMoldovaMongoliaMoroccoMozambiqueMyanmarNepalNetherlandsNew CaledoniaNew ZealandNicaraguaNigerNigeriaNorth AmericaNorthern Mariana IslandsNorwayOECD membersOmanOther small statesPakistanPanamaPapua New GuineaParaguayPeruPhilippinesPolandPortugalPost-demographic dividendPre-demographic dividendPuerto RicoQatarRomaniaRussian FederationRwandaSamoaSao Tome and PrincipeSaudi ArabiaSenegalSerbiaSeychellesSierra LeoneSlovak RepublicSloveniaSmall statesSolomon IslandsSomaliaSouth AfricaSouth AsiaSouth Asia (IDA & IBRD)SpainSri LankaSt. Kitts and NevisSt. LuciaSt. Vincent and the GrenadinesSub-Saharan Africa Sub-Saharan Africa (excluding high income)Sub-Saharan Africa (IDA & IBRD countries)SudanSurinameSwazilandSwedenSwitzerlandSyrian Arab RepublicTajikistanTanzaniaThailandTimor-LesteTogoTongaTrinidad and TobagoTunisiaTurkeyTurkmenistanUgandaUkraineUnited Arab EmiratesUnited KingdomUnited StatesUpper middle incomeUruguayVanuatuVenezuela, RBVietnamVirgin Islands (U.S.)West Bank and GazaWorldYemen, Rep.ZambiaZimbabwe Linha do tempo:
Nesta escala de tempo está apresentado um gráfico de 1962 ano até 2006 ano Denmark. Dados de 1961 ano ausente. O número de observações reais por data: 45.
Fonte (nome):
Indicadores de desenvolvimento mundial
Fonte (organização):
Food and Agriculture Organization, electronic files and web site.
Categorias:
Agriculture & Rural Development
Foi atualizado:
23 abr 2017 ano
Indicadores de alterações dos valores ao longo dos anos
Mínimo:
459.084
1 jan 1962 ano
Máximo:
725.563
1 jan 1978 ano
Na data de observação
Valor
Mudança absoluta
A alteração em relação ao valor anterior
1 jan 1962 ano
459.084
+459.084
0.0%
1 jan 1963 ano
493.011
+33.927
7.39%
1 jan 1964 ano
531.483
+38.472
7.8%
1 jan 1965 ano
573.529
+42.046
7.91%
1 jan 1966 ano
600.572
+27.043
4.72%
1 jan 1967 ano
619.103
+18.531
3.09%
1 jan 1968 ano
638.287
+19.184
3.1%
1 jan 1969 ano
644.896
+6.609
1.04%
1 jan 1970 ano
649.19
+4.294
0.67%
1 jan 1971 ano
656.291
+7.101
1.09%
1 jan 1972 ano
653.57
-2.721
-0.41%
1 jan 1973 ano
651.995
-1.575
-0.24%
1 jan 1974 ano
673.848
+21.853
3.35%
1 jan 1975 ano
691.632
+17.783
2.64%
1 jan 1976 ano
698.113
+6.481
0.94%
1 jan 1977 ano
687.309
-10.804
-1.55%
1 jan 1978 ano
725.563
+38.254
5.57%
1 jan 1979 ano
718.551
-7.012
-0.97%
1 jan 1980 ano
718.191
-0.36
-0.05%
1 jan 1981 ano
717.795
-0.396
-0.06%
1 jan 1982 ano
687.71
-30.085
-4.19%
1 jan 1983 ano
696.331
+8.621
1.25%
1 jan 1984 ano
678.75
-17.58
-2.52%
1 jan 1985 ano
649.736
-29.015
-4.27%
1 jan 1986 ano
639.423
-10.313
-1.59%
1 jan 1987 ano
649.861
+10.438
1.63%
1 jan 1988 ano
639.833
-10.028
-1.54%
1 jan 1989 ano
655.363
+15.53
2.43%
1 jan 1990 ano
651.898
-3.465
-0.53%
1 jan 1991 ano
634.733
-17.165
-2.63%
1 jan 1992 ano
629.462
-5.27
-0.83%
1 jan 1993 ano
610.599
-18.864
-3.0%
1 jan 1994 ano
610.533
-0.066
-0.01%
1 jan 1995 ano
619.759
+9.226
1.51%
1 jan 1996 ano
651.488
+31.729
5.12%
1 jan 1997 ano
601.288
-50.2
-7.71%
1 jan 1998 ano
597.433
-3.854
-0.64%
1 jan 1999 ano
549.451
-47.983
-8.03%
1 jan 2000 ano
563.98
+14.529
2.64%
1 jan 2001 ano
540.206
-23.774
-4.22%
1 jan 2002 ano
529.036
-11.17
-2.07%
1 jan 2003 ano
524.121
-4.915
-0.93%
1 jan 2004 ano
517.763
-6.359
-1.21%
1 jan 2005 ano
508.418
-9.345
-1.8%
1 jan 2006 ano
486.286
-22.131
-4.35%
Classificação de países por estatísticas atuais por anos


Comentários: