29
/pt/
pt
AIzaSyAYiBZKx7MnpbEhh9jyipgxe19OcubqV5w
April 1, 2024
93855
Bulgaria
BGR
true
2
1
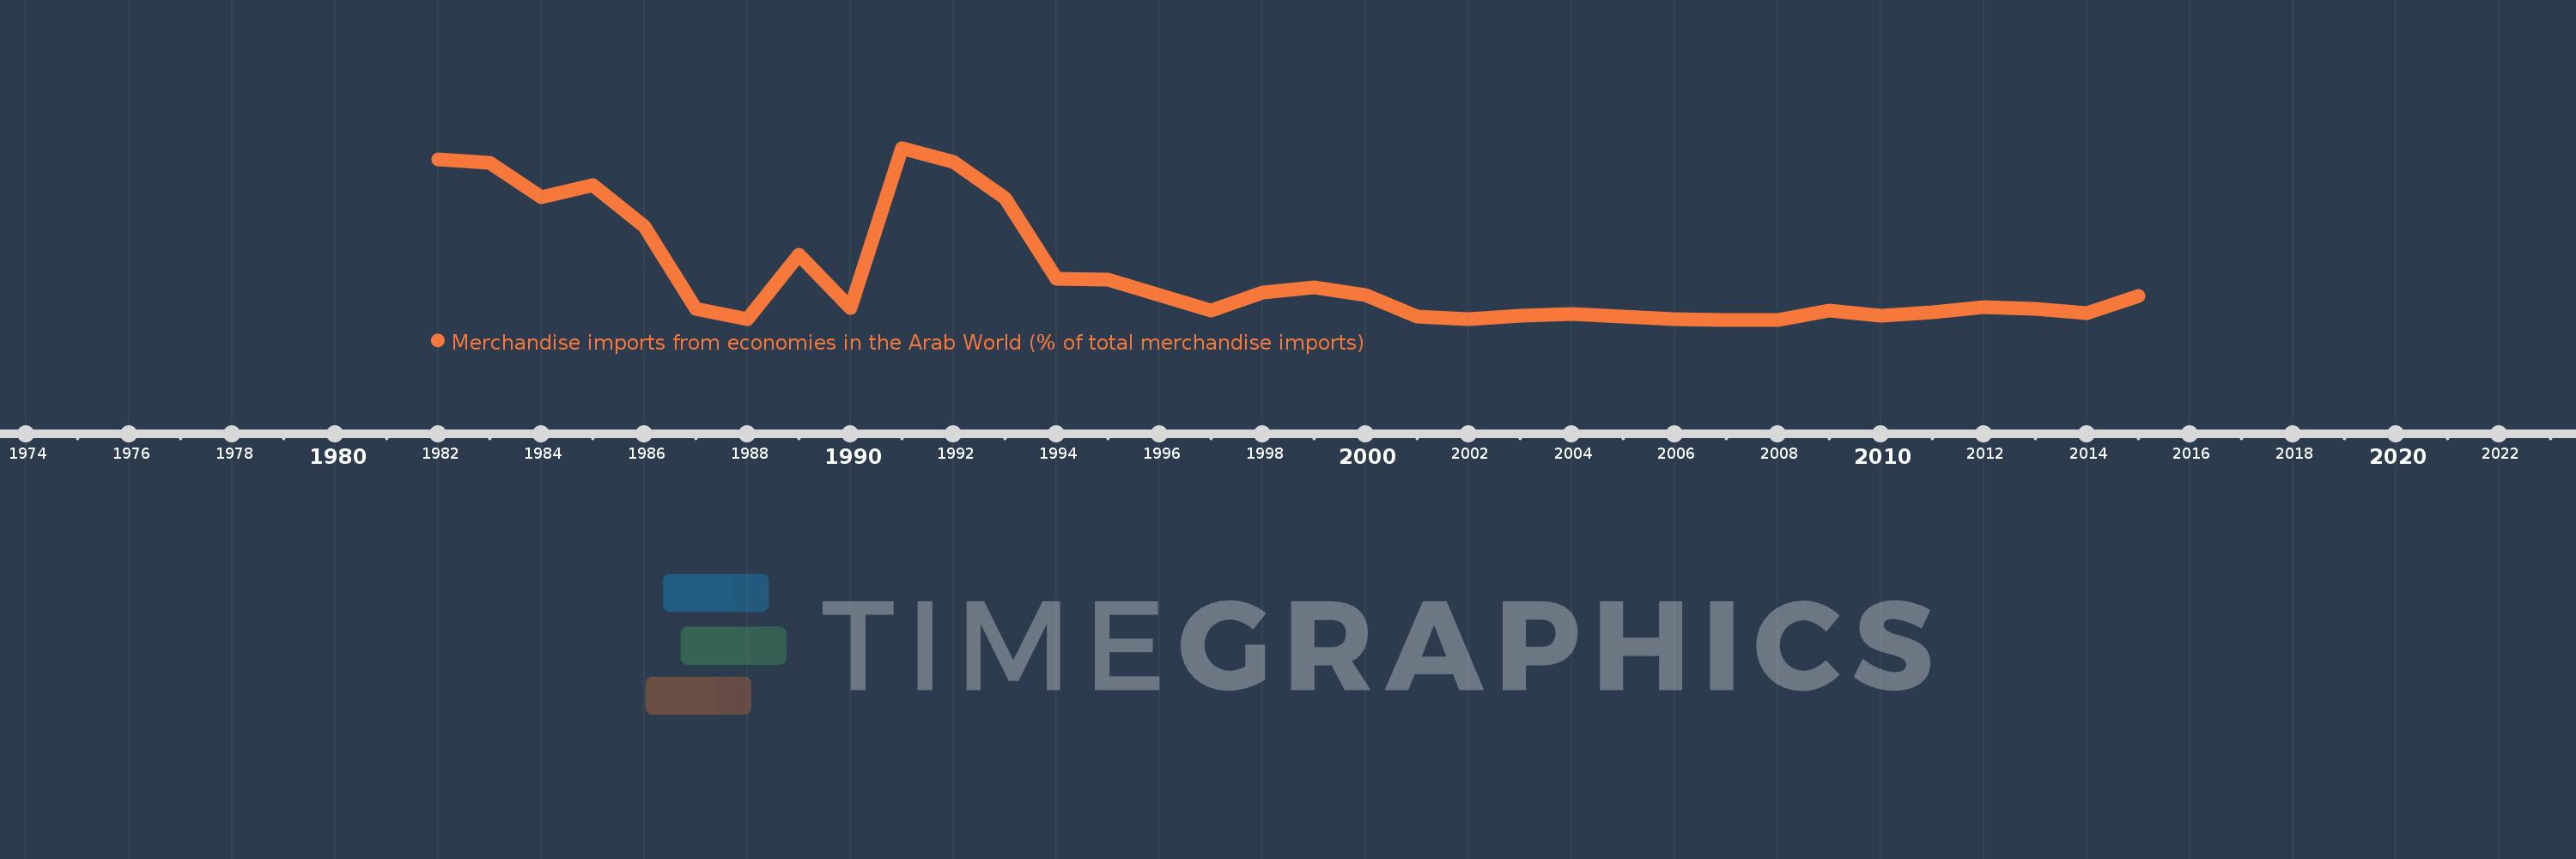
Merchandise imports from economies in the Arab World (% of total merchandise imports)
2015,2014,2013,2012,2011,2010,2009,2008,2007,2006,2005,2004,2003,2002,2001,2000,1999,1998,1997,1996,1995,1994,1993,1992,1991,1990,1989,1988,1987,1986,1985,1984,1983,1982
Estas estatísticas em outros países:
AfghanistanAlbaniaAlgeriaAngolaArab WorldArgentinaArmeniaArubaAustraliaAustriaAzerbaijanBahamas, TheBahrainBangladeshBarbadosBelarusBelgiumBelizeBeninBermudaBoliviaBrazilBrunei DarussalamBulgariaBurkina FasoBurundiCabo VerdeCambodiaCameroonCanadaCaribbean small statesCentral African RepublicCentral Europe and the BalticsChadChileChinaColombiaComorosCongo, Dem. Rep.Congo, Rep.Costa RicaCote d'IvoireCroatiaCubaCyprusCzech RepublicDenmarkDjiboutiDominicaDominican RepublicEarly-demographic dividendEast Asia & PacificEast Asia & Pacific (excluding high income)East Asia & Pacific (IDA & IBRD countries)EcuadorEgypt, Arab Rep.El SalvadorEstoniaEthiopiaEuro areaEurope & Central AsiaEurope & Central Asia (excluding high income)Europe & Central Asia (IDA & IBRD countries)European UnionFijiFinlandFragile and conflict affected situationsFranceFrench PolynesiaGabonGambia, TheGeorgiaGermanyGhanaGreeceGreenlandGrenadaGuatemalaGuineaGuinea-BissauGuyanaHaitiHeavily indebted poor countries (HIPC)High incomeHondurasHong Kong SAR, ChinaHungaryIBRD onlyIcelandIDA & IBRD totalIDA blendIDA onlyIDA totalIndiaIndonesiaIran, Islamic Rep.IraqIrelandItalyJamaicaJapanJordanKazakhstanKenyaKorea, Dem. People’s Rep.Korea, Rep.KuwaitKyrgyz RepublicLao PDRLate-demographic dividendLatin America & Caribbean Latin America & Caribbean (excluding high income)Latin America & the Caribbean (IDA & IBRD countries)LatviaLeast developed countries: UN classificationLebanonLiberiaLibyaLithuaniaLow & middle incomeLow incomeLower middle incomeLuxembourgMacao SAR, ChinaMacedonia, FYRMadagascarMalawiMalaysiaMaldivesMaliMaltaMauritaniaMauritiusMexicoMiddle East & North AfricaMiddle East & North Africa (excluding high income)Middle East & North Africa (IDA & IBRD countries)Middle incomeMoldovaMongoliaMontenegroMoroccoMozambiqueMyanmarNepalNetherlandsNew CaledoniaNew ZealandNicaraguaNigerNigeriaNorth AmericaNorwayOECD membersOmanOther small statesPacific island small statesPakistanPanamaPapua New GuineaParaguayPeruPhilippinesPolandPortugalPost-demographic dividendPre-demographic dividendQatarRomaniaRussian FederationRwandaSaudi ArabiaSenegalSerbiaSeychellesSierra LeoneSingaporeSlovak RepublicSloveniaSmall statesSomaliaSouth AfricaSouth AsiaSouth Asia (IDA & IBRD)SpainSri LankaSt. LuciaSt. Vincent and the GrenadinesSub-Saharan Africa Sub-Saharan Africa (excluding high income)Sub-Saharan Africa (IDA & IBRD countries)SudanSurinameSwedenSwitzerlandSyrian Arab RepublicTajikistanTanzaniaThailandTogoTrinidad and TobagoTunisiaTurkeyTurkmenistanUgandaUkraineUnited Arab EmiratesUnited KingdomUnited StatesUpper middle incomeUruguayVenezuela, RBVietnamWorldYemen, Rep.ZambiaZimbabwe Linha do tempo:
Nesta escala de tempo está apresentado um gráfico de 1982 ano até 2015 ano Bulgaria. Dados de 1981 ano ausente. O número de observações reais por data: 34.
Fonte (nome):
Indicadores de desenvolvimento mundial
Fonte (organização):
World Bank staff estimates based data from International Monetary Fund's Direction of Trade database.
Categorias:
Private Sector, Trade
Foi atualizado:
23 abr 2017 ano
Indicadores de alterações dos valores ao longo dos anos
Mínimo:
0.493
1 jan 2007 ano
Máximo:
10.125
1 jan 1991 ano
Na data de observação
Valor
Mudança absoluta
A alteração em relação ao valor anterior
1 jan 1982 ano
9.5
+9.5
0.0%
1 jan 1983 ano
9.29
-0.209
-2.2%
1 jan 1984 ano
7.387
-1.903
-20.49%
1 jan 1985 ano
8.019
+0.632
8.56%
1 jan 1986 ano
5.704
-2.315
-28.86%
1 jan 1987 ano
1.108
-4.597
-80.58%
1 jan 1988 ano
0.539
-0.568
-51.31%
1 jan 1989 ano
4.162
+3.622
671.57%
1 jan 1990 ano
1.132
-3.029
-72.79%
1 jan 1991 ano
10.125
+8.993
794.26%
1 jan 1992 ano
9.317
-0.808
-7.98%
1 jan 1993 ano
7.331
-1.986
-21.31%
1 jan 1994 ano
2.769
-4.562
-62.23%
1 jan 1995 ano
2.76
-0.009
-0.32%
1 jan 1996 ano
1.883
-0.877
-31.76%
1 jan 1997 ano
0.989
-0.894
-47.49%
1 jan 1998 ano
2.015
+1.026
103.75%
1 jan 1999 ano
2.293
+0.278
13.81%
1 jan 2000 ano
1.872
-0.422
-18.38%
1 jan 2001 ano
0.677
-1.194
-63.81%
1 jan 2002 ano
0.507
-0.17
-25.16%
1 jan 2003 ano
0.706
+0.199
39.35%
1 jan 2004 ano
0.815
+0.108
15.32%
1 jan 2005 ano
0.665
-0.15
-18.43%
1 jan 2006 ano
0.541
-0.124
-18.61%
1 jan 2007 ano
0.493
-0.048
-8.9%
1 jan 2008 ano
0.499
+0.006
1.29%
1 jan 2009 ano
0.99
+0.491
98.3%
1 jan 2010 ano
0.73
-0.259
-26.21%
1 jan 2011 ano
0.913
+0.183
25.03%
1 jan 2012 ano
1.188
+0.274
30.05%
1 jan 2013 ano
1.114
-0.074
-6.23%
1 jan 2014 ano
0.861
-0.253
-22.69%
1 jan 2015 ano
1.812
+0.951
110.49%
Classificação de países por estatísticas atuais por anos


Comentários: