29
/pt/
pt
AIzaSyAYiBZKx7MnpbEhh9jyipgxe19OcubqV5w
April 1, 2024
87525
Bolivia
BOL
true
2
1
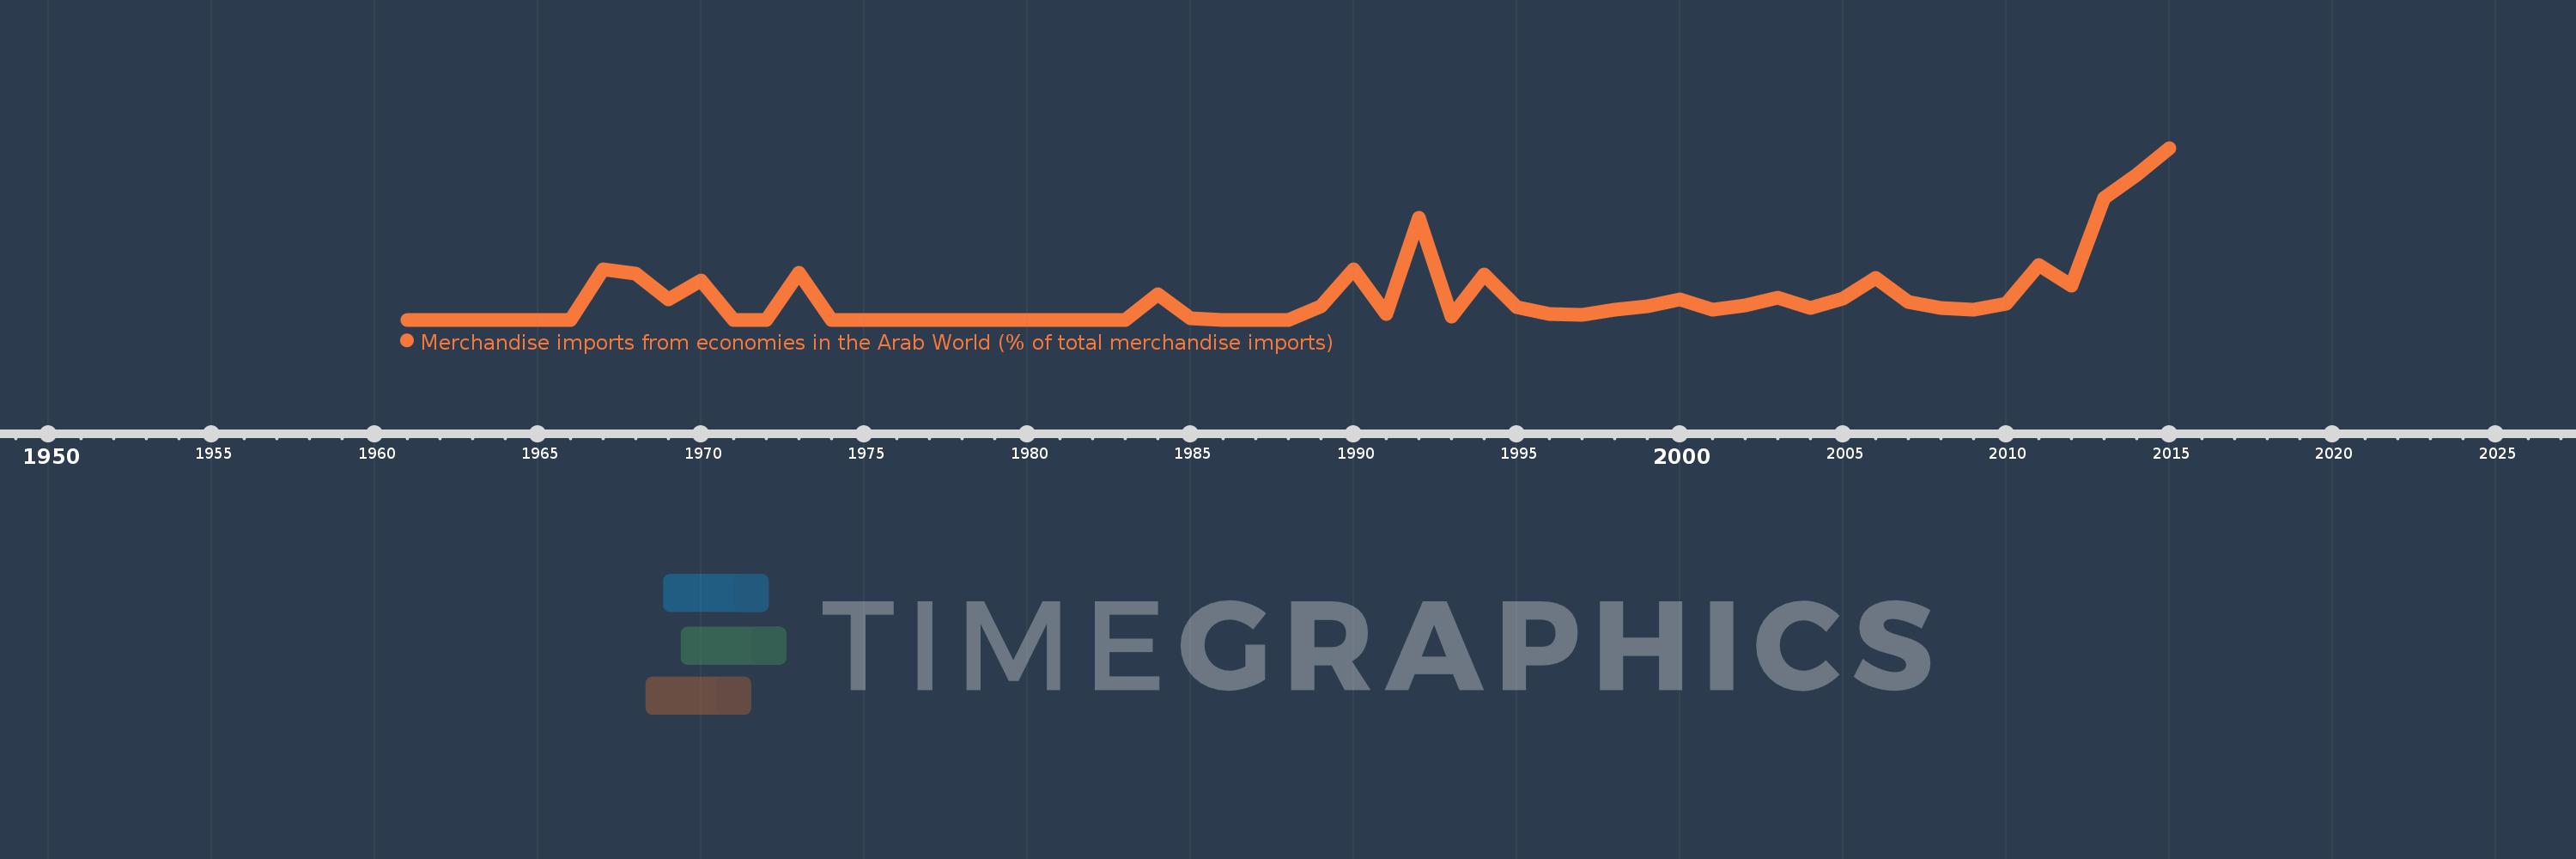
Merchandise imports from economies in the Arab World (% of total merchandise imports)
2015,2014,2013,2012,2011,2010,2009,2008,2007,2006,2005,2004,2003,2002,2001,2000,1999,1998,1997,1996,1995,1994,1993,1992,1991,1990,1989,1988,1987,1986,1985,1984,1983,1982,1981,1980,1979,1978,1977,1976,1975,1974,1973,1972,1971,1970,1969,1968,1967,1966,1965,1964,1963,1962,1961
Estas estatísticas em outros países:
AfghanistanAlbaniaAlgeriaAngolaArab WorldArgentinaArmeniaArubaAustraliaAustriaAzerbaijanBahamas, TheBahrainBangladeshBarbadosBelarusBelgiumBelizeBeninBermudaBoliviaBrazilBrunei DarussalamBulgariaBurkina FasoBurundiCabo VerdeCambodiaCameroonCanadaCaribbean small statesCentral African RepublicCentral Europe and the BalticsChadChileChinaColombiaComorosCongo, Dem. Rep.Congo, Rep.Costa RicaCote d'IvoireCroatiaCubaCyprusCzech RepublicDenmarkDjiboutiDominicaDominican RepublicEarly-demographic dividendEast Asia & PacificEast Asia & Pacific (excluding high income)East Asia & Pacific (IDA & IBRD countries)EcuadorEgypt, Arab Rep.El SalvadorEstoniaEthiopiaEuro areaEurope & Central AsiaEurope & Central Asia (excluding high income)Europe & Central Asia (IDA & IBRD countries)European UnionFijiFinlandFragile and conflict affected situationsFranceFrench PolynesiaGabonGambia, TheGeorgiaGermanyGhanaGreeceGreenlandGrenadaGuatemalaGuineaGuinea-BissauGuyanaHaitiHeavily indebted poor countries (HIPC)High incomeHondurasHong Kong SAR, ChinaHungaryIBRD onlyIcelandIDA & IBRD totalIDA blendIDA onlyIDA totalIndiaIndonesiaIran, Islamic Rep.IraqIrelandItalyJamaicaJapanJordanKazakhstanKenyaKorea, Dem. People’s Rep.Korea, Rep.KuwaitKyrgyz RepublicLao PDRLate-demographic dividendLatin America & Caribbean Latin America & Caribbean (excluding high income)Latin America & the Caribbean (IDA & IBRD countries)LatviaLeast developed countries: UN classificationLebanonLiberiaLibyaLithuaniaLow & middle incomeLow incomeLower middle incomeLuxembourgMacao SAR, ChinaMacedonia, FYRMadagascarMalawiMalaysiaMaldivesMaliMaltaMauritaniaMauritiusMexicoMiddle East & North AfricaMiddle East & North Africa (excluding high income)Middle East & North Africa (IDA & IBRD countries)Middle incomeMoldovaMongoliaMontenegroMoroccoMozambiqueMyanmarNepalNetherlandsNew CaledoniaNew ZealandNicaraguaNigerNigeriaNorth AmericaNorwayOECD membersOmanOther small statesPacific island small statesPakistanPanamaPapua New GuineaParaguayPeruPhilippinesPolandPortugalPost-demographic dividendPre-demographic dividendQatarRomaniaRussian FederationRwandaSaudi ArabiaSenegalSerbiaSeychellesSierra LeoneSingaporeSlovak RepublicSloveniaSmall statesSomaliaSouth AfricaSouth AsiaSouth Asia (IDA & IBRD)SpainSri LankaSt. LuciaSt. Vincent and the GrenadinesSub-Saharan Africa Sub-Saharan Africa (excluding high income)Sub-Saharan Africa (IDA & IBRD countries)SudanSurinameSwedenSwitzerlandSyrian Arab RepublicTajikistanTanzaniaThailandTogoTrinidad and TobagoTunisiaTurkeyTurkmenistanUgandaUkraineUnited Arab EmiratesUnited KingdomUnited StatesUpper middle incomeUruguayVenezuela, RBVietnamWorldYemen, Rep.ZambiaZimbabwe Linha do tempo:
Nesta escala de tempo está apresentado um gráfico de 1961 ano até 2015 ano Bolivia. Dados de 1960 ano ausente. O número de observações reais por data: 55.
Fonte (nome):
Indicadores de desenvolvimento mundial
Fonte (organização):
World Bank staff estimates based data from International Monetary Fund's Direction of Trade database.
Categorias:
Private Sector, Trade
Foi atualizado:
23 abr 2017 ano
Indicadores de alterações dos valores ao longo dos anos
Máximo:
0.246
1 jan 2015 ano
Na data de observação
Valor
Mudança absoluta
A alteração em relação ao valor anterior
1 jan 1961 ano
0.0
0.0
0.0%
1 jan 1967 ano
0.072
+0.072
%
1 jan 1968 ano
0.066
-0.006
-8.4%
1 jan 1969 ano
0.029
-0.037
-55.49%
1 jan 1970 ano
0.056
+0.026
89.38%
1 jan 1971 ano
0.0
-0.056
-100.0%
1 jan 1973 ano
0.067
+0.067
%
1 jan 1974 ano
0.0
-0.067
-100.0%
1 jan 1984 ano
0.037
+0.037
%
1 jan 1985 ano
0.002
-0.035
-95.34%
1 jan 1986 ano
0.0
-0.002
-100.0%
1 jan 1989 ano
0.019
+0.019
%
1 jan 1990 ano
0.072
+0.053
271.09%
1 jan 1991 ano
0.008
-0.064
-88.53%
1 jan 1992 ano
0.146
+0.138
1.66 mil%
1 jan 1993 ano
0.005
-0.141
-96.81%
1 jan 1994 ano
0.065
+0.06
1.29 mil%
1 jan 1995 ano
0.018
-0.047
-72.67%
1 jan 1996 ano
0.008
-0.009
-52.11%
1 jan 1997 ano
0.007
-0.001
-16.79%
1 jan 1998 ano
0.014
+0.007
95.32%
1 jan 1999 ano
0.019
+0.005
37.03%
1 jan 2000 ano
0.029
+0.01
54.91%
1 jan 2001 ano
0.015
-0.014
-47.99%
1 jan 2002 ano
0.02
+0.005
32.42%
1 jan 2003 ano
0.031
+0.011
54.1%
1 jan 2004 ano
0.017
-0.014
-44.76%
1 jan 2005 ano
0.03
+0.013
74.63%
1 jan 2006 ano
0.06
+0.03
101.09%
1 jan 2007 ano
0.025
-0.035
-57.88%
1 jan 2008 ano
0.017
-0.008
-32.09%
1 jan 2009 ano
0.015
-0.002
-10.09%
1 jan 2010 ano
0.023
+0.008
48.87%
1 jan 2011 ano
0.078
+0.055
236.99%
1 jan 2012 ano
0.049
-0.029
-36.89%
1 jan 2013 ano
0.174
+0.125
254.0%
1 jan 2014 ano
0.207
+0.033
19.03%
1 jan 2015 ano
0.246
+0.039
18.95%
Classificação de países por estatísticas atuais por anos


Comentários: