29
/pt/
pt
AIzaSyAYiBZKx7MnpbEhh9jyipgxe19OcubqV5w
April 1, 2024
142075
Greece
GRC
true
2
1
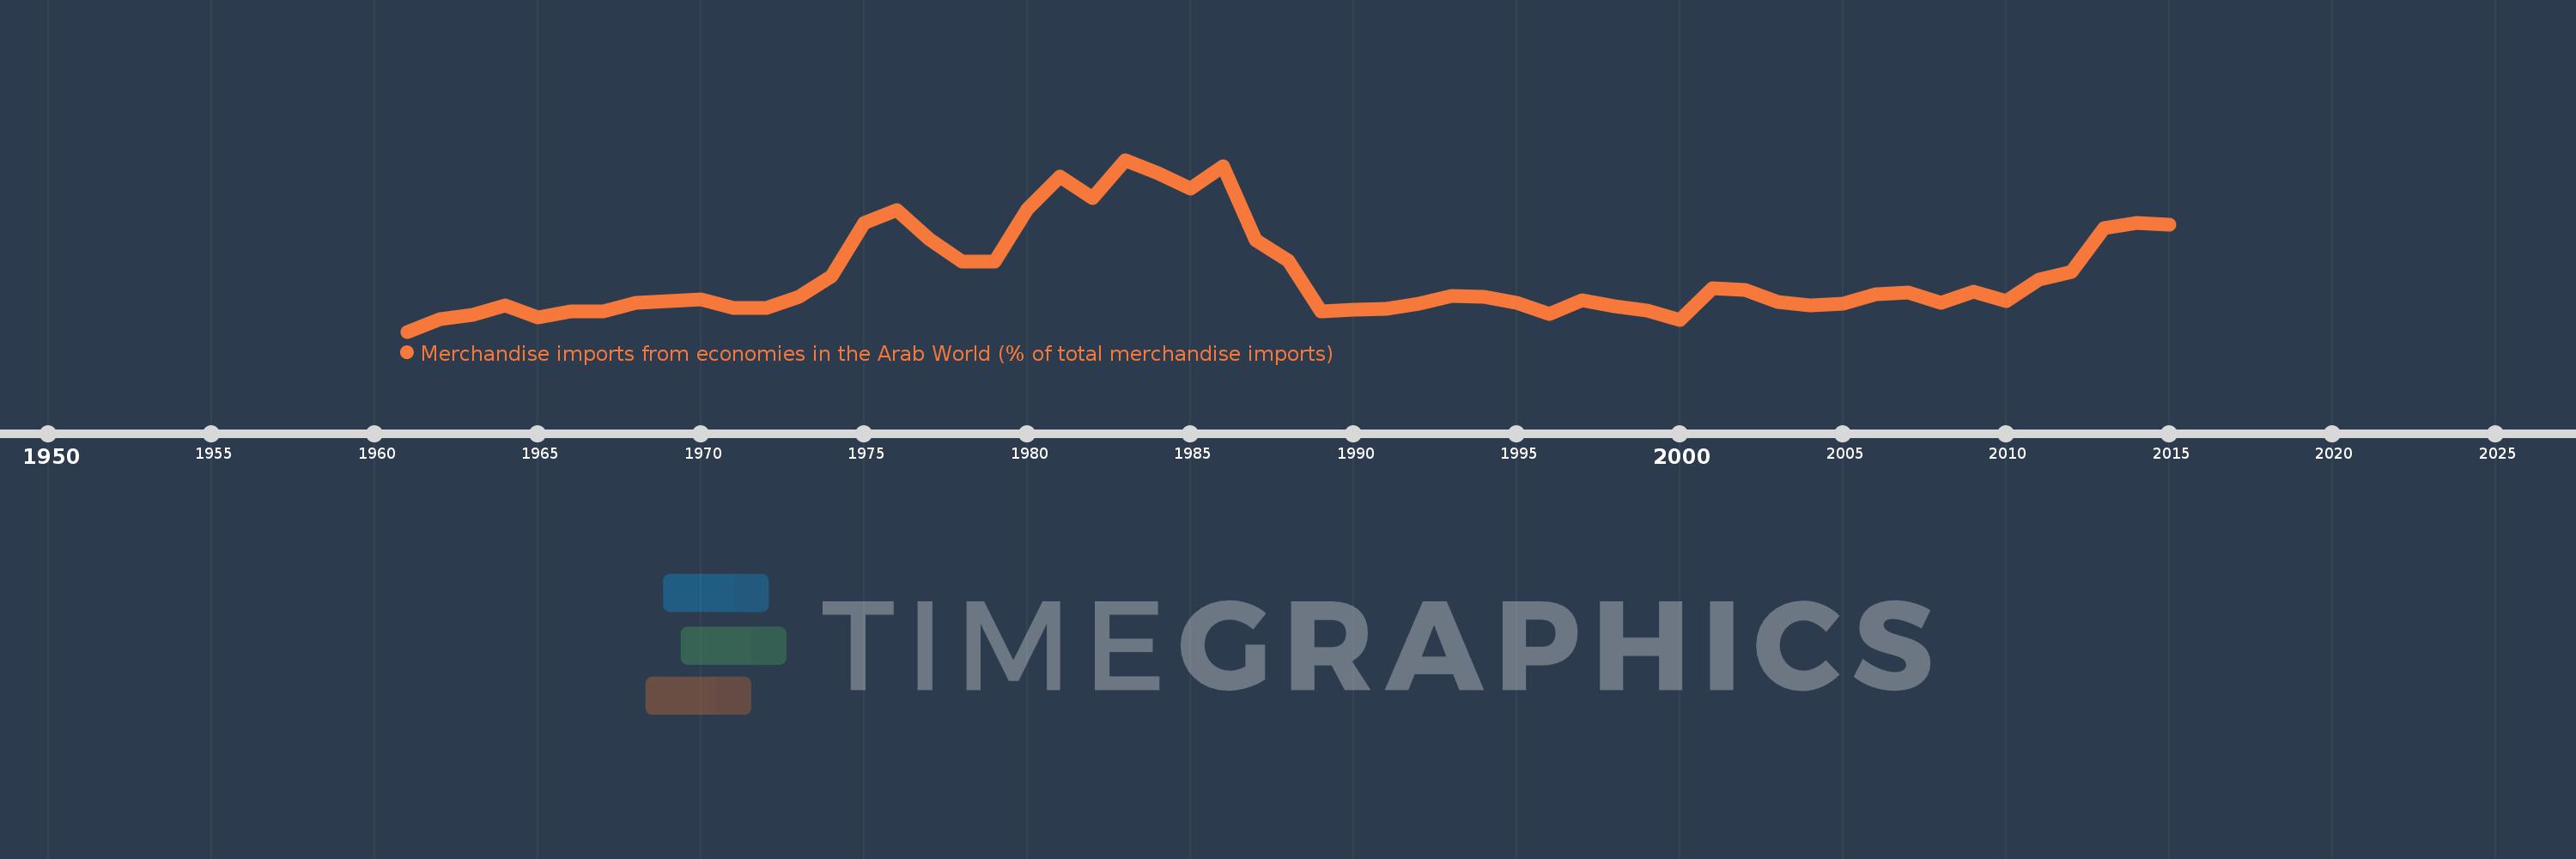
Merchandise imports from economies in the Arab World (% of total merchandise imports)
2015,2014,2013,2012,2011,2010,2009,2008,2007,2006,2005,2004,2003,2002,2001,2000,1999,1998,1997,1996,1995,1994,1993,1992,1991,1990,1989,1988,1987,1986,1985,1984,1983,1982,1981,1980,1979,1978,1977,1976,1975,1974,1973,1972,1971,1970,1969,1968,1967,1966,1965,1964,1963,1962,1961
Estas estatísticas em outros países:
AfghanistanAlbaniaAlgeriaAngolaArab WorldArgentinaArmeniaArubaAustraliaAustriaAzerbaijanBahamas, TheBahrainBangladeshBarbadosBelarusBelgiumBelizeBeninBermudaBoliviaBrazilBrunei DarussalamBulgariaBurkina FasoBurundiCabo VerdeCambodiaCameroonCanadaCaribbean small statesCentral African RepublicCentral Europe and the BalticsChadChileChinaColombiaComorosCongo, Dem. Rep.Congo, Rep.Costa RicaCote d'IvoireCroatiaCubaCyprusCzech RepublicDenmarkDjiboutiDominicaDominican RepublicEarly-demographic dividendEast Asia & PacificEast Asia & Pacific (excluding high income)East Asia & Pacific (IDA & IBRD countries)EcuadorEgypt, Arab Rep.El SalvadorEstoniaEthiopiaEuro areaEurope & Central AsiaEurope & Central Asia (excluding high income)Europe & Central Asia (IDA & IBRD countries)European UnionFijiFinlandFragile and conflict affected situationsFranceFrench PolynesiaGabonGambia, TheGeorgiaGermanyGhanaGreeceGreenlandGrenadaGuatemalaGuineaGuinea-BissauGuyanaHaitiHeavily indebted poor countries (HIPC)High incomeHondurasHong Kong SAR, ChinaHungaryIBRD onlyIcelandIDA & IBRD totalIDA blendIDA onlyIDA totalIndiaIndonesiaIran, Islamic Rep.IraqIrelandItalyJamaicaJapanJordanKazakhstanKenyaKorea, Dem. People’s Rep.Korea, Rep.KuwaitKyrgyz RepublicLao PDRLate-demographic dividendLatin America & Caribbean Latin America & Caribbean (excluding high income)Latin America & the Caribbean (IDA & IBRD countries)LatviaLeast developed countries: UN classificationLebanonLiberiaLibyaLithuaniaLow & middle incomeLow incomeLower middle incomeLuxembourgMacao SAR, ChinaMacedonia, FYRMadagascarMalawiMalaysiaMaldivesMaliMaltaMauritaniaMauritiusMexicoMiddle East & North AfricaMiddle East & North Africa (excluding high income)Middle East & North Africa (IDA & IBRD countries)Middle incomeMoldovaMongoliaMontenegroMoroccoMozambiqueMyanmarNepalNetherlandsNew CaledoniaNew ZealandNicaraguaNigerNigeriaNorth AmericaNorwayOECD membersOmanOther small statesPacific island small statesPakistanPanamaPapua New GuineaParaguayPeruPhilippinesPolandPortugalPost-demographic dividendPre-demographic dividendQatarRomaniaRussian FederationRwandaSaudi ArabiaSenegalSerbiaSeychellesSierra LeoneSingaporeSlovak RepublicSloveniaSmall statesSomaliaSouth AfricaSouth AsiaSouth Asia (IDA & IBRD)SpainSri LankaSt. LuciaSt. Vincent and the GrenadinesSub-Saharan Africa Sub-Saharan Africa (excluding high income)Sub-Saharan Africa (IDA & IBRD countries)SudanSurinameSwedenSwitzerlandSyrian Arab RepublicTajikistanTanzaniaThailandTogoTrinidad and TobagoTunisiaTurkeyTurkmenistanUgandaUkraineUnited Arab EmiratesUnited KingdomUnited StatesUpper middle incomeUruguayVenezuela, RBVietnamWorldYemen, Rep.ZambiaZimbabwe Linha do tempo:
Nesta escala de tempo está apresentado um gráfico de 1961 ano até 2015 ano Greece. Dados de 1960 ano ausente. O número de observações reais por data: 55.
Fonte (nome):
Indicadores de desenvolvimento mundial
Fonte (organização):
World Bank staff estimates based data from International Monetary Fund's Direction of Trade database.
Categorias:
Private Sector, Trade
Foi atualizado:
23 abr 2017 ano
Indicadores de alterações dos valores ao longo dos anos
Mínimo:
1.317
1 jan 1961 ano
Máximo:
23.421
1 jan 1983 ano
Na data de observação
Valor
Mudança absoluta
A alteração em relação ao valor anterior
1 jan 1961 ano
1.317
+1.317
0.0%
1 jan 1962 ano
2.871
+1.554
117.93%
1 jan 1963 ano
3.461
+0.589
20.53%
1 jan 1964 ano
4.697
+1.237
35.74%
1 jan 1965 ano
3.174
-1.524
-32.44%
1 jan 1966 ano
3.942
+0.769
24.22%
1 jan 1967 ano
3.937
-0.005
-0.13%
1 jan 1968 ano
5.052
+1.115
28.33%
1 jan 1969 ano
5.246
+0.193
3.83%
1 jan 1970 ano
5.448
+0.202
3.86%
1 jan 1971 ano
4.387
-1.061
-19.48%
1 jan 1972 ano
4.369
-0.018
-0.41%
1 jan 1973 ano
5.755
+1.386
31.73%
1 jan 1974 ano
8.464
+2.709
47.07%
1 jan 1975 ano
15.339
+6.875
81.23%
1 jan 1976 ano
16.997
+1.659
10.81%
1 jan 1977 ano
13.219
-3.778
-22.23%
1 jan 1978 ano
10.34
-2.88
-21.78%
1 jan 1979 ano
10.291
-0.049
-0.47%
1 jan 1980 ano
17.06
+6.769
65.78%
1 jan 1981 ano
21.249
+4.189
24.55%
1 jan 1982 ano
18.536
-2.713
-12.77%
1 jan 1983 ano
23.421
+4.885
26.36%
1 jan 1984 ano
21.671
-1.75
-7.47%
1 jan 1985 ano
19.713
-1.958
-9.04%
1 jan 1986 ano
22.601
+2.888
14.65%
1 jan 1987 ano
13.069
-9.532
-42.18%
1 jan 1988 ano
10.485
-2.584
-19.77%
1 jan 1989 ano
3.882
-6.603
-62.98%
1 jan 1990 ano
4.093
+0.211
5.44%
1 jan 1991 ano
4.257
+0.165
4.02%
1 jan 1992 ano
4.91
+0.652
15.33%
1 jan 1993 ano
5.849
+0.939
19.12%
1 jan 1994 ano
5.789
-0.06
-1.03%
1 jan 1995 ano
4.981
-0.807
-13.94%
1 jan 1996 ano
3.577
-1.404
-28.19%
1 jan 1997 ano
5.337
+1.759
49.19%
1 jan 1998 ano
4.618
-0.718
-13.46%
1 jan 1999 ano
4.068
-0.551
-11.92%
1 jan 2000 ano
2.827
-1.241
-30.51%
1 jan 2001 ano
6.923
+4.096
144.92%
1 jan 2002 ano
6.664
-0.259
-3.74%
1 jan 2003 ano
5.087
-1.577
-23.66%
1 jan 2004 ano
4.656
-0.431
-8.48%
1 jan 2005 ano
4.898
+0.243
5.21%
1 jan 2006 ano
6.127
+1.228
25.07%
1 jan 2007 ano
6.293
+0.166
2.71%
1 jan 2008 ano
5.001
-1.291
-20.52%
1 jan 2009 ano
6.435
+1.434
28.67%
1 jan 2010 ano
5.214
-1.221
-18.97%
1 jan 2011 ano
7.955
+2.741
52.56%
1 jan 2012 ano
9.017
+1.062
13.35%
1 jan 2013 ano
14.594
+5.577
61.85%
1 jan 2014 ano
15.347
+0.753
5.16%
1 jan 2015 ano
15.077
-0.27
-1.76%
Classificação de países por estatísticas atuais por anos


Comentários: