29
/pt/
pt
AIzaSyAYiBZKx7MnpbEhh9jyipgxe19OcubqV5w
April 1, 2024
222482
Peru
PER
true
2
1
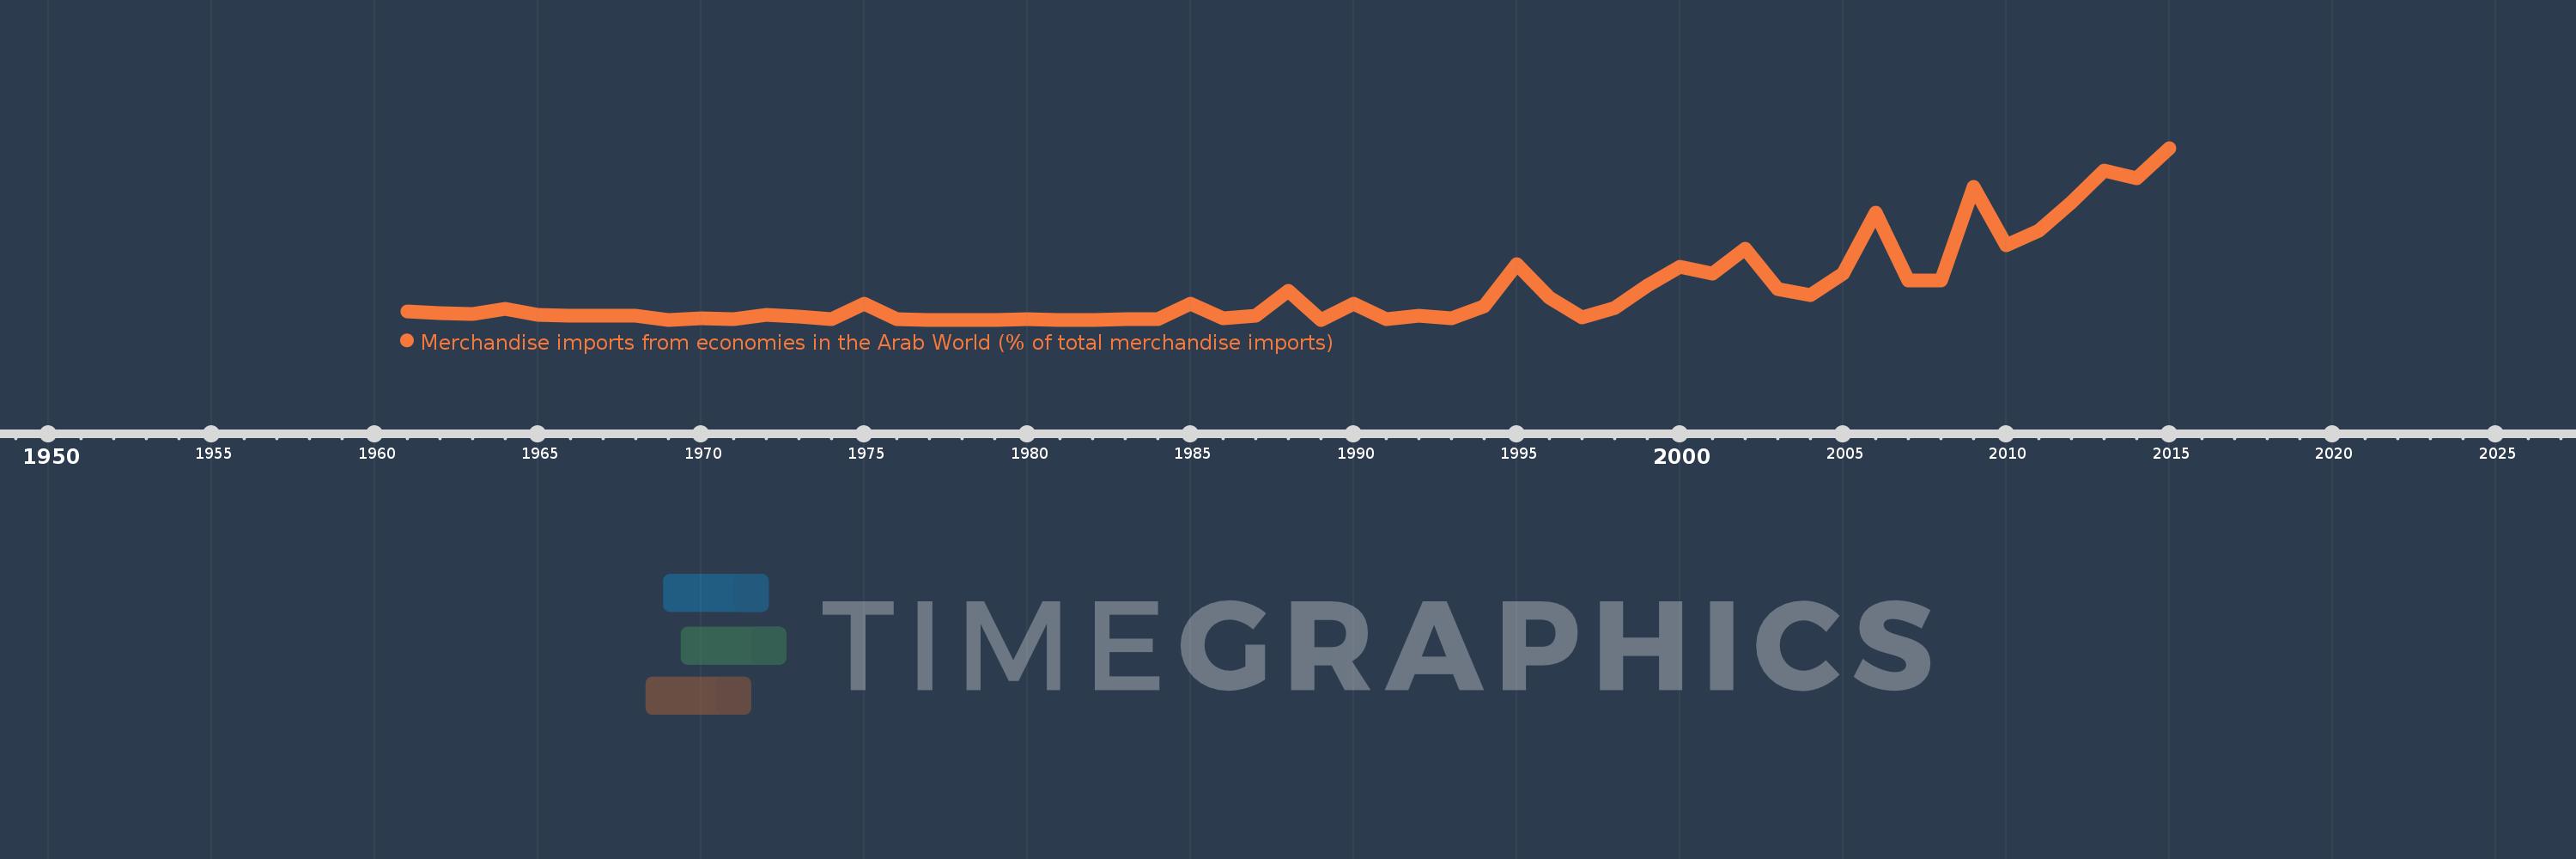
Merchandise imports from economies in the Arab World (% of total merchandise imports)
2015,2014,2013,2012,2011,2010,2009,2008,2007,2006,2005,2004,2003,2002,2001,2000,1999,1998,1997,1996,1995,1994,1993,1992,1991,1990,1989,1988,1987,1986,1985,1984,1983,1982,1981,1980,1979,1978,1977,1976,1975,1974,1973,1972,1971,1970,1969,1968,1967,1966,1965,1964,1963,1962,1961
Estas estatísticas em outros países:
AfghanistanAlbaniaAlgeriaAngolaArab WorldArgentinaArmeniaArubaAustraliaAustriaAzerbaijanBahamas, TheBahrainBangladeshBarbadosBelarusBelgiumBelizeBeninBermudaBoliviaBrazilBrunei DarussalamBulgariaBurkina FasoBurundiCabo VerdeCambodiaCameroonCanadaCaribbean small statesCentral African RepublicCentral Europe and the BalticsChadChileChinaColombiaComorosCongo, Dem. Rep.Congo, Rep.Costa RicaCote d'IvoireCroatiaCubaCyprusCzech RepublicDenmarkDjiboutiDominicaDominican RepublicEarly-demographic dividendEast Asia & PacificEast Asia & Pacific (excluding high income)East Asia & Pacific (IDA & IBRD countries)EcuadorEgypt, Arab Rep.El SalvadorEstoniaEthiopiaEuro areaEurope & Central AsiaEurope & Central Asia (excluding high income)Europe & Central Asia (IDA & IBRD countries)European UnionFijiFinlandFragile and conflict affected situationsFranceFrench PolynesiaGabonGambia, TheGeorgiaGermanyGhanaGreeceGreenlandGrenadaGuatemalaGuineaGuinea-BissauGuyanaHaitiHeavily indebted poor countries (HIPC)High incomeHondurasHong Kong SAR, ChinaHungaryIBRD onlyIcelandIDA & IBRD totalIDA blendIDA onlyIDA totalIndiaIndonesiaIran, Islamic Rep.IraqIrelandItalyJamaicaJapanJordanKazakhstanKenyaKorea, Dem. People’s Rep.Korea, Rep.KuwaitKyrgyz RepublicLao PDRLate-demographic dividendLatin America & Caribbean Latin America & Caribbean (excluding high income)Latin America & the Caribbean (IDA & IBRD countries)LatviaLeast developed countries: UN classificationLebanonLiberiaLibyaLithuaniaLow & middle incomeLow incomeLower middle incomeLuxembourgMacao SAR, ChinaMacedonia, FYRMadagascarMalawiMalaysiaMaldivesMaliMaltaMauritaniaMauritiusMexicoMiddle East & North AfricaMiddle East & North Africa (excluding high income)Middle East & North Africa (IDA & IBRD countries)Middle incomeMoldovaMongoliaMontenegroMoroccoMozambiqueMyanmarNepalNetherlandsNew CaledoniaNew ZealandNicaraguaNigerNigeriaNorth AmericaNorwayOECD membersOmanOther small statesPacific island small statesPakistanPanamaPapua New GuineaParaguayPeruPhilippinesPolandPortugalPost-demographic dividendPre-demographic dividendQatarRomaniaRussian FederationRwandaSaudi ArabiaSenegalSerbiaSeychellesSierra LeoneSingaporeSlovak RepublicSloveniaSmall statesSomaliaSouth AfricaSouth AsiaSouth Asia (IDA & IBRD)SpainSri LankaSt. LuciaSt. Vincent and the GrenadinesSub-Saharan Africa Sub-Saharan Africa (excluding high income)Sub-Saharan Africa (IDA & IBRD countries)SudanSurinameSwedenSwitzerlandSyrian Arab RepublicTajikistanTanzaniaThailandTogoTrinidad and TobagoTunisiaTurkeyTurkmenistanUgandaUkraineUnited Arab EmiratesUnited KingdomUnited StatesUpper middle incomeUruguayVenezuela, RBVietnamWorldYemen, Rep.ZambiaZimbabwe Linha do tempo:
Nesta escala de tempo está apresentado um gráfico de 1961 ano até 2015 ano Peru. Dados de 1960 ano ausente. O número de observações reais por data: 55.
Fonte (nome):
Indicadores de desenvolvimento mundial
Fonte (organização):
World Bank staff estimates based data from International Monetary Fund's Direction of Trade database.
Categorias:
Private Sector, Trade
Foi atualizado:
23 abr 2017 ano
Indicadores de alterações dos valores ao longo dos anos
Máximo:
0.571
1 jan 2015 ano
Na data de observação
Valor
Mudança absoluta
A alteração em relação ao valor anterior
1 jan 1961 ano
0.027
+0.027
0.0%
1 jan 1962 ano
0.021
-0.005
-20.4%
1 jan 1963 ano
0.019
-0.003
-12.69%
1 jan 1964 ano
0.036
+0.017
92.75%
1 jan 1965 ano
0.017
-0.019
-51.89%
1 jan 1966 ano
0.014
-0.004
-20.59%
1 jan 1967 ano
0.012
-0.001
-10.81%
1 jan 1968 ano
0.012
+0.0
0.47%
1 jan 1969 ano
0.0
-0.012
-100.0%
1 jan 1970 ano
0.005
+0.005
%
1 jan 1971 ano
0.002
-0.003
-67.59%
1 jan 1972 ano
0.015
+0.013
804.48%
1 jan 1973 ano
0.01
-0.005
-31.37%
1 jan 1974 ano
0.002
-0.008
-80.56%
1 jan 1975 ano
0.054
+0.052
2.65 mil%
1 jan 1976 ano
0.002
-0.051
-95.36%
1 jan 1977 ano
0.0
-0.002
-100.0%
1 jan 1980 ano
0.001
+0.001
%
1 jan 1981 ano
0.0
-0.001
-100.0%
1 jan 1983 ano
0.003
+0.003
%
1 jan 1984 ano
0.001
-0.002
-55.75%
1 jan 1985 ano
0.053
+0.052
3.85 mil%
1 jan 1986 ano
0.005
-0.048
-90.36%
1 jan 1987 ano
0.014
+0.008
165.81%
1 jan 1988 ano
0.096
+0.082
604.93%
1 jan 1989 ano
0.0
-0.096
-100.0%
1 jan 1990 ano
0.052
+0.052
%
1 jan 1991 ano
0.001
-0.051
-99.0%
1 jan 1992 ano
0.013
+0.012
2.35 mil%
1 jan 1993 ano
0.006
-0.007
-54.38%
1 jan 1994 ano
0.046
+0.04
692.2%
1 jan 1995 ano
0.185
+0.139
301.0%
1 jan 1996 ano
0.074
-0.111
-60.02%
1 jan 1997 ano
0.009
-0.065
-88.28%
1 jan 1998 ano
0.04
+0.031
359.91%
1 jan 1999 ano
0.114
+0.074
185.92%
1 jan 2000 ano
0.176
+0.062
54.35%
1 jan 2001 ano
0.153
-0.023
-13.07%
1 jan 2002 ano
0.236
+0.083
54.51%
1 jan 2003 ano
0.102
-0.135
-56.93%
1 jan 2004 ano
0.082
-0.02
-19.34%
1 jan 2005 ano
0.152
+0.07
85.62%
1 jan 2006 ano
0.355
+0.203
133.08%
1 jan 2007 ano
0.13
-0.225
-63.4%
1 jan 2008 ano
0.131
+0.001
0.68%
1 jan 2009 ano
0.443
+0.312
238.35%
1 jan 2010 ano
0.248
-0.195
-44.01%
1 jan 2011 ano
0.295
+0.047
19.09%
1 jan 2012 ano
0.39
+0.094
31.92%
1 jan 2013 ano
0.496
+0.107
27.4%
1 jan 2014 ano
0.47
-0.026
-5.27%
1 jan 2015 ano
0.571
+0.101
21.46%
Classificação de países por estatísticas atuais por anos


Comentários: