29
/pt/
pt
AIzaSyAYiBZKx7MnpbEhh9jyipgxe19OcubqV5w
April 1, 2024
91441
Brazil
BRA
true
2
1
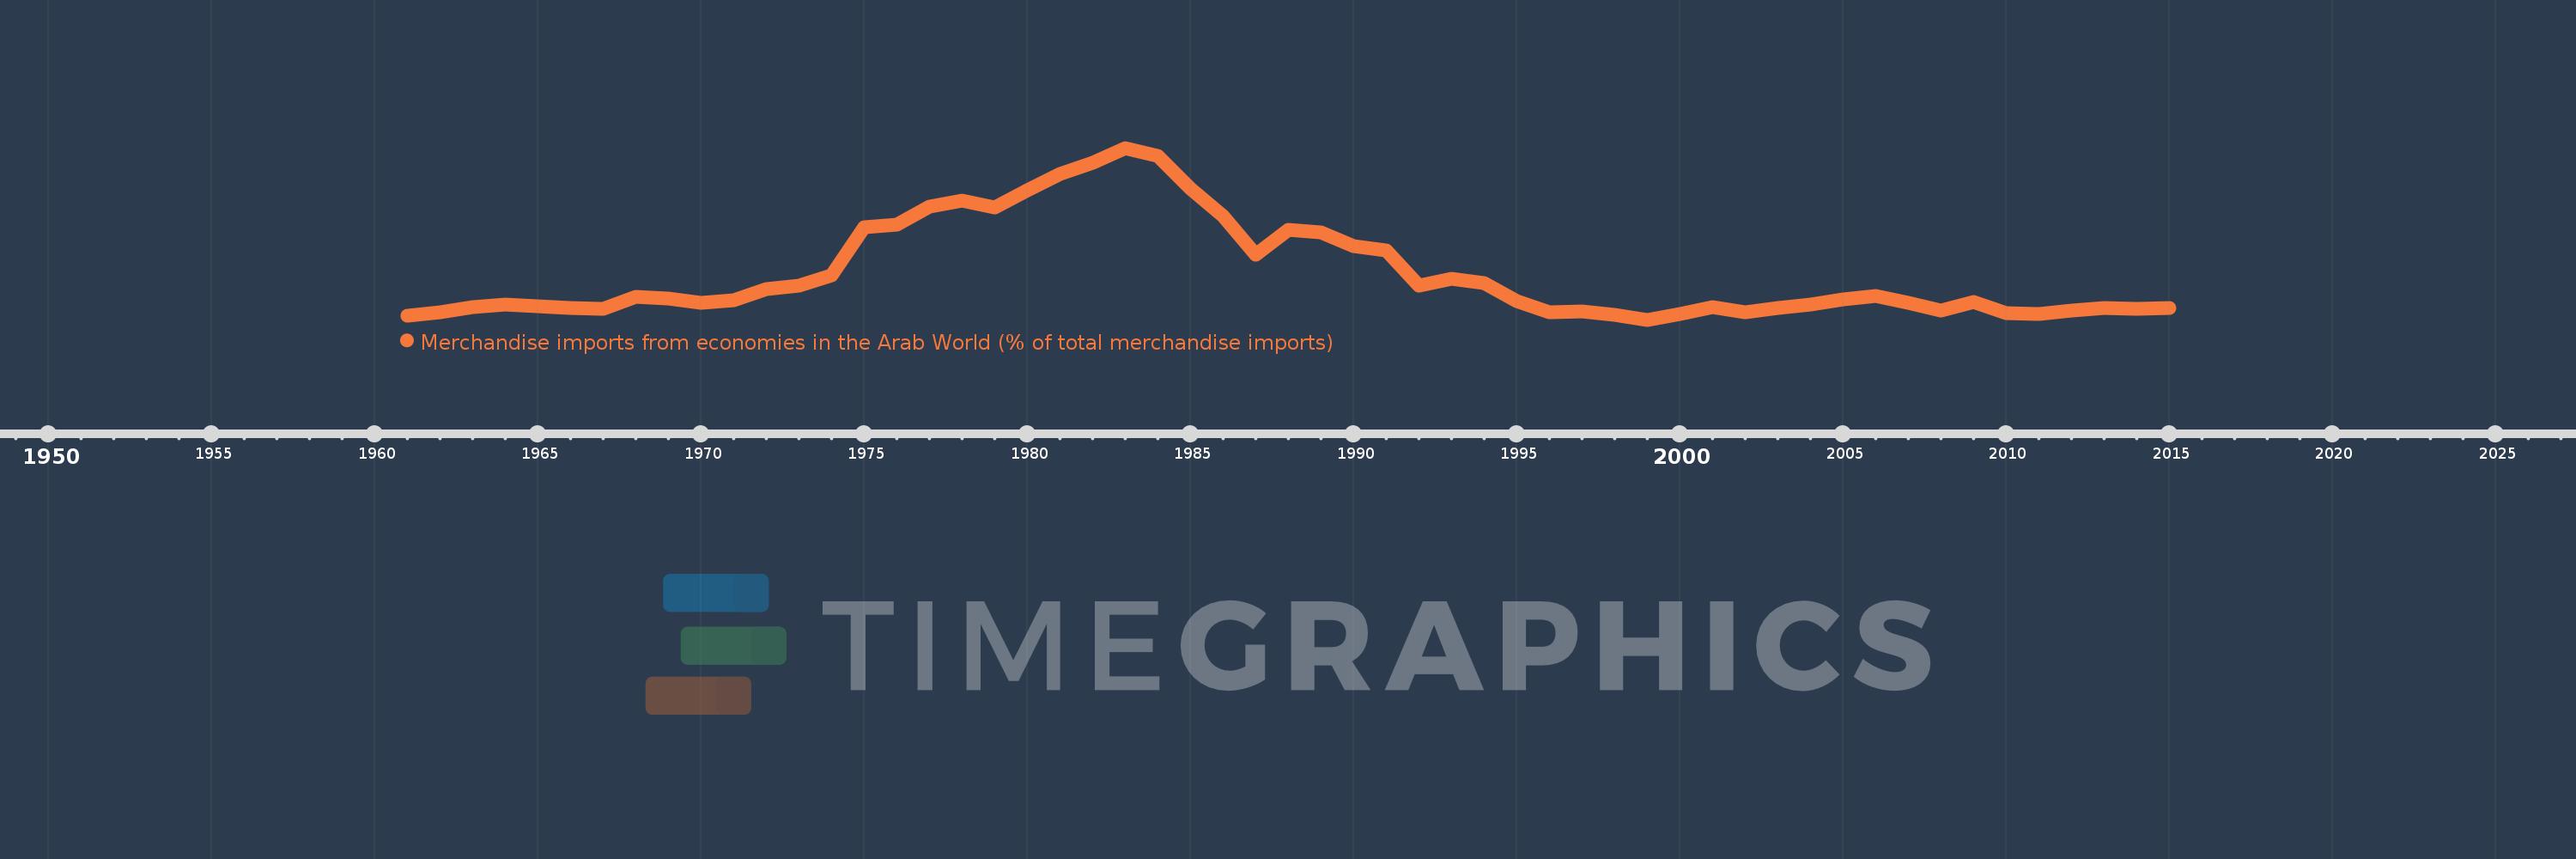
Merchandise imports from economies in the Arab World (% of total merchandise imports)
2015,2014,2013,2012,2011,2010,2009,2008,2007,2006,2005,2004,2003,2002,2001,2000,1999,1998,1997,1996,1995,1994,1993,1992,1991,1990,1989,1988,1987,1986,1985,1984,1983,1982,1981,1980,1979,1978,1977,1976,1975,1974,1973,1972,1971,1970,1969,1968,1967,1966,1965,1964,1963,1962,1961
Estas estatísticas em outros países:
AfghanistanAlbaniaAlgeriaAngolaArab WorldArgentinaArmeniaArubaAustraliaAustriaAzerbaijanBahamas, TheBahrainBangladeshBarbadosBelarusBelgiumBelizeBeninBermudaBoliviaBrazilBrunei DarussalamBulgariaBurkina FasoBurundiCabo VerdeCambodiaCameroonCanadaCaribbean small statesCentral African RepublicCentral Europe and the BalticsChadChileChinaColombiaComorosCongo, Dem. Rep.Congo, Rep.Costa RicaCote d'IvoireCroatiaCubaCyprusCzech RepublicDenmarkDjiboutiDominicaDominican RepublicEarly-demographic dividendEast Asia & PacificEast Asia & Pacific (excluding high income)East Asia & Pacific (IDA & IBRD countries)EcuadorEgypt, Arab Rep.El SalvadorEstoniaEthiopiaEuro areaEurope & Central AsiaEurope & Central Asia (excluding high income)Europe & Central Asia (IDA & IBRD countries)European UnionFijiFinlandFragile and conflict affected situationsFranceFrench PolynesiaGabonGambia, TheGeorgiaGermanyGhanaGreeceGreenlandGrenadaGuatemalaGuineaGuinea-BissauGuyanaHaitiHeavily indebted poor countries (HIPC)High incomeHondurasHong Kong SAR, ChinaHungaryIBRD onlyIcelandIDA & IBRD totalIDA blendIDA onlyIDA totalIndiaIndonesiaIran, Islamic Rep.IraqIrelandItalyJamaicaJapanJordanKazakhstanKenyaKorea, Dem. People’s Rep.Korea, Rep.KuwaitKyrgyz RepublicLao PDRLate-demographic dividendLatin America & Caribbean Latin America & Caribbean (excluding high income)Latin America & the Caribbean (IDA & IBRD countries)LatviaLeast developed countries: UN classificationLebanonLiberiaLibyaLithuaniaLow & middle incomeLow incomeLower middle incomeLuxembourgMacao SAR, ChinaMacedonia, FYRMadagascarMalawiMalaysiaMaldivesMaliMaltaMauritaniaMauritiusMexicoMiddle East & North AfricaMiddle East & North Africa (excluding high income)Middle East & North Africa (IDA & IBRD countries)Middle incomeMoldovaMongoliaMontenegroMoroccoMozambiqueMyanmarNepalNetherlandsNew CaledoniaNew ZealandNicaraguaNigerNigeriaNorth AmericaNorwayOECD membersOmanOther small statesPacific island small statesPakistanPanamaPapua New GuineaParaguayPeruPhilippinesPolandPortugalPost-demographic dividendPre-demographic dividendQatarRomaniaRussian FederationRwandaSaudi ArabiaSenegalSerbiaSeychellesSierra LeoneSingaporeSlovak RepublicSloveniaSmall statesSomaliaSouth AfricaSouth AsiaSouth Asia (IDA & IBRD)SpainSri LankaSt. LuciaSt. Vincent and the GrenadinesSub-Saharan Africa Sub-Saharan Africa (excluding high income)Sub-Saharan Africa (IDA & IBRD countries)SudanSurinameSwedenSwitzerlandSyrian Arab RepublicTajikistanTanzaniaThailandTogoTrinidad and TobagoTunisiaTurkeyTurkmenistanUgandaUkraineUnited Arab EmiratesUnited KingdomUnited StatesUpper middle incomeUruguayVenezuela, RBVietnamWorldYemen, Rep.ZambiaZimbabwe Linha do tempo:
Nesta escala de tempo está apresentado um gráfico de 1961 ano até 2015 ano Brazil. Dados de 1960 ano ausente. O número de observações reais por data: 55.
Fonte (nome):
Indicadores de desenvolvimento mundial
Fonte (organização):
World Bank staff estimates based data from International Monetary Fund's Direction of Trade database.
Categorias:
Private Sector, Trade
Foi atualizado:
23 abr 2017 ano
Indicadores de alterações dos valores ao longo dos anos
Mínimo:
2.697
1 jan 1999 ano
Máximo:
35.485
1 jan 1983 ano
Na data de observação
Valor
Mudança absoluta
A alteração em relação ao valor anterior
1 jan 1961 ano
3.466
+3.466
0.0%
1 jan 1962 ano
4.197
+0.731
21.1%
1 jan 1963 ano
5.184
+0.986
23.5%
1 jan 1964 ano
5.598
+0.414
7.99%
1 jan 1965 ano
5.195
-0.403
-7.2%
1 jan 1966 ano
4.917
-0.278
-5.35%
1 jan 1967 ano
4.843
-0.074
-1.51%
1 jan 1968 ano
7.047
+2.204
45.51%
1 jan 1969 ano
6.752
-0.295
-4.18%
1 jan 1970 ano
5.884
-0.869
-12.86%
1 jan 1971 ano
6.344
+0.461
7.83%
1 jan 1972 ano
8.526
+2.182
34.39%
1 jan 1973 ano
9.272
+0.746
8.75%
1 jan 1974 ano
11.105
+1.833
19.77%
1 jan 1975 ano
20.425
+9.32
83.92%
1 jan 1976 ano
20.863
+0.438
2.14%
1 jan 1977 ano
24.263
+3.4
16.3%
1 jan 1978 ano
25.467
+1.204
4.96%
1 jan 1979 ano
24.168
-1.299
-5.1%
1 jan 1980 ano
27.453
+3.285
13.59%
1 jan 1981 ano
30.521
+3.069
11.18%
1 jan 1982 ano
32.704
+2.182
7.15%
1 jan 1983 ano
35.485
+2.781
8.5%
1 jan 1984 ano
33.909
-1.576
-4.44%
1 jan 1985 ano
27.727
-6.182
-18.23%
1 jan 1986 ano
22.436
-5.291
-19.08%
1 jan 1987 ano
15.103
-7.333
-32.68%
1 jan 1988 ano
19.93
+4.827
31.96%
1 jan 1989 ano
19.414
-0.516
-2.59%
1 jan 1990 ano
16.805
-2.609
-13.44%
1 jan 1991 ano
15.852
-0.953
-5.67%
1 jan 1992 ano
9.264
-6.588
-41.56%
1 jan 1993 ano
10.447
+1.183
12.77%
1 jan 1994 ano
9.704
-0.742
-7.11%
1 jan 1995 ano
6.209
-3.495
-36.02%
1 jan 1996 ano
4.069
-2.14
-34.47%
1 jan 1997 ano
4.233
+0.164
4.04%
1 jan 1998 ano
3.696
-0.537
-12.68%
1 jan 1999 ano
2.697
-1.0
-27.04%
1 jan 2000 ano
3.778
+1.081
40.09%
1 jan 2001 ano
5.125
+1.347
35.65%
1 jan 2002 ano
4.183
-0.942
-18.37%
1 jan 2003 ano
4.997
+0.813
19.45%
1 jan 2004 ano
5.585
+0.588
11.77%
1 jan 2005 ano
6.598
+1.013
18.15%
1 jan 2006 ano
7.22
+0.622
9.43%
1 jan 2007 ano
5.965
-1.255
-17.38%
1 jan 2008 ano
4.524
-1.441
-24.16%
1 jan 2009 ano
6.047
+1.523
33.67%
1 jan 2010 ano
3.893
-2.154
-35.62%
1 jan 2011 ano
3.835
-0.058
-1.49%
1 jan 2012 ano
4.413
+0.578
15.08%
1 jan 2013 ano
4.972
+0.559
12.67%
1 jan 2014 ano
4.758
-0.215
-4.32%
1 jan 2015 ano
4.989
+0.231
4.85%
Classificação de países por estatísticas atuais por anos


Comentários: