29
/pt/
pt
AIzaSyAYiBZKx7MnpbEhh9jyipgxe19OcubqV5w
April 1, 2024
54228
Pacific island small states
PSS
false
2
1
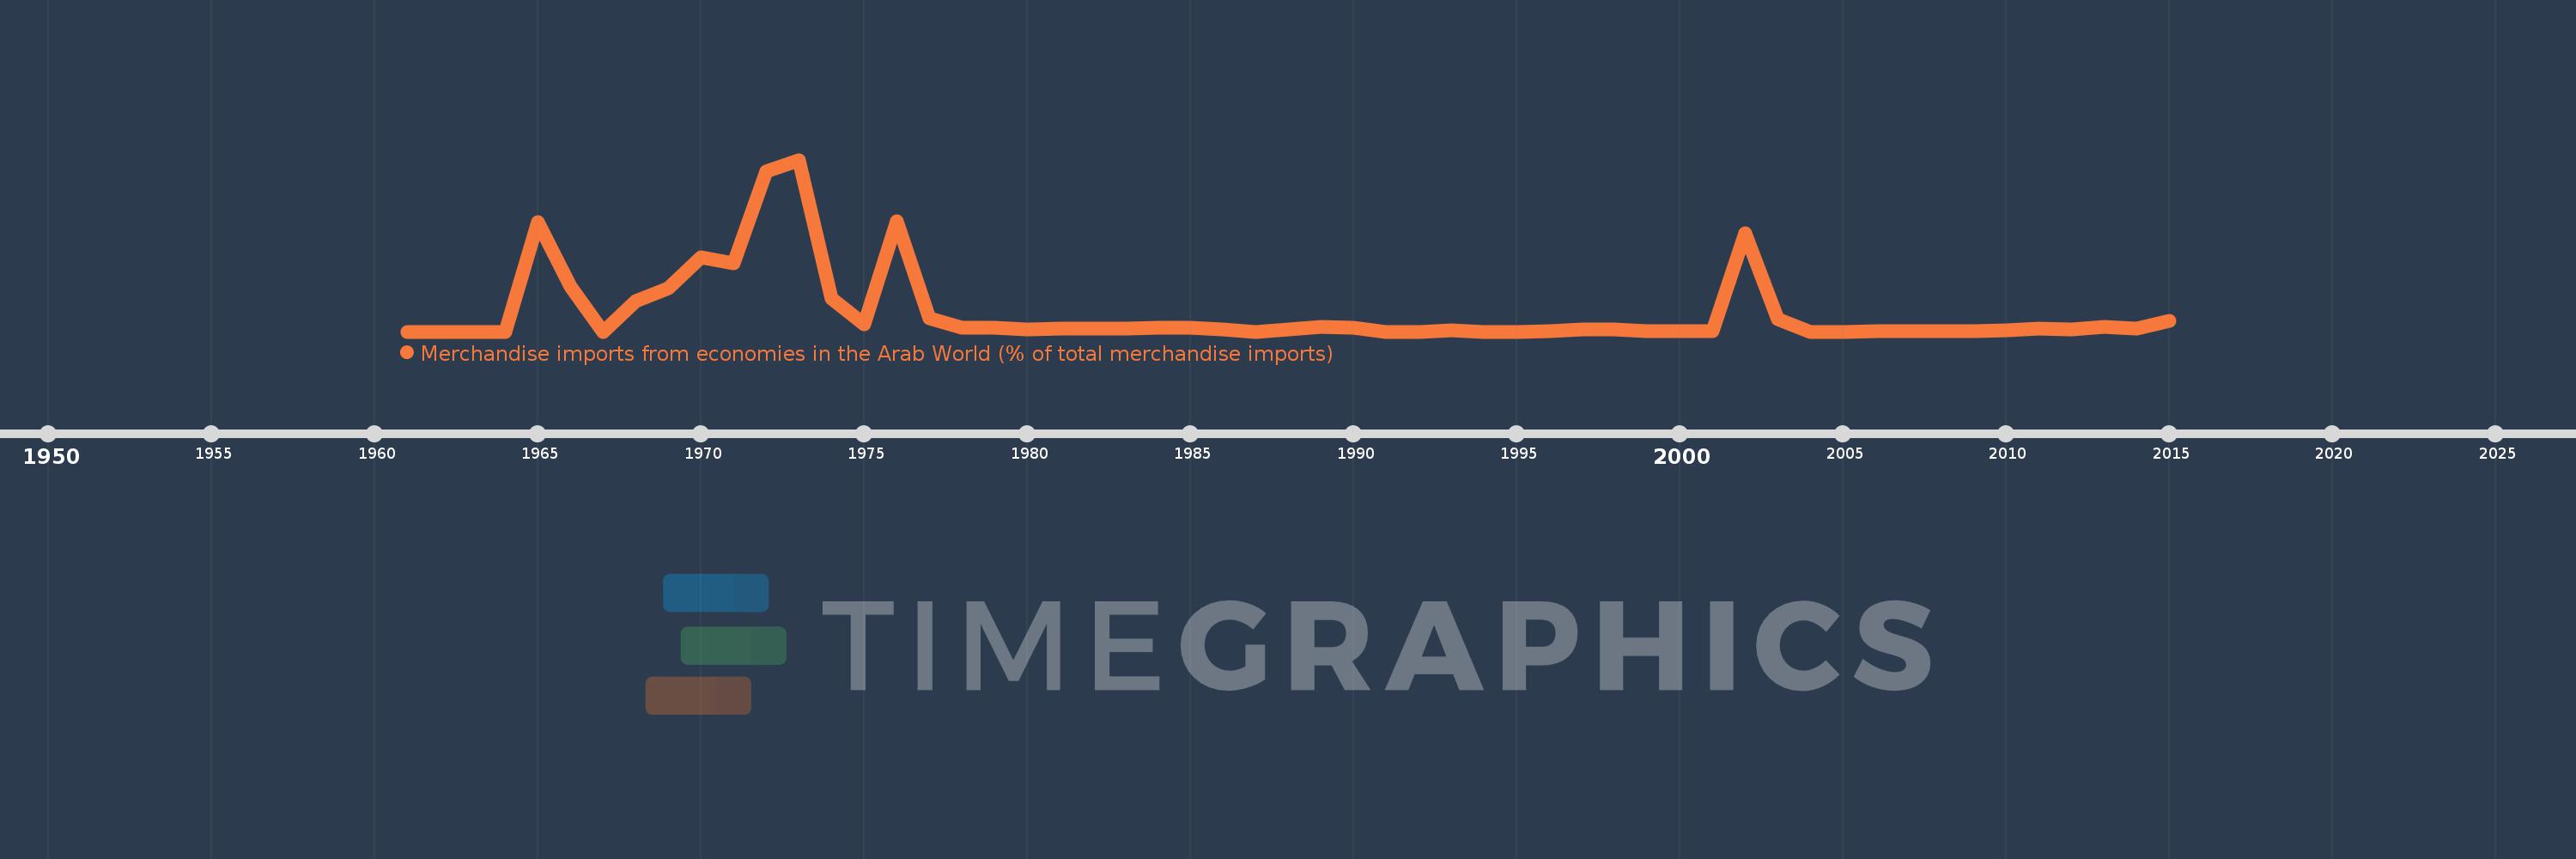
Merchandise imports from economies in the Arab World (% of total merchandise imports)
2015,2014,2013,2012,2011,2010,2009,2008,2007,2006,2005,2004,2003,2002,2001,2000,1999,1998,1997,1996,1995,1994,1993,1992,1991,1990,1989,1988,1987,1986,1985,1984,1983,1982,1981,1980,1979,1978,1977,1976,1975,1974,1973,1972,1971,1970,1969,1968,1967,1966,1965,1964,1963,1962,1961
Estas estatísticas em outros países:
AfghanistanAlbaniaAlgeriaAngolaArab WorldArgentinaArmeniaArubaAustraliaAustriaAzerbaijanBahamas, TheBahrainBangladeshBarbadosBelarusBelgiumBelizeBeninBermudaBoliviaBrazilBrunei DarussalamBulgariaBurkina FasoBurundiCabo VerdeCambodiaCameroonCanadaCaribbean small statesCentral African RepublicCentral Europe and the BalticsChadChileChinaColombiaComorosCongo, Dem. Rep.Congo, Rep.Costa RicaCote d'IvoireCroatiaCubaCyprusCzech RepublicDenmarkDjiboutiDominicaDominican RepublicEarly-demographic dividendEast Asia & PacificEast Asia & Pacific (excluding high income)East Asia & Pacific (IDA & IBRD countries)EcuadorEgypt, Arab Rep.El SalvadorEstoniaEthiopiaEuro areaEurope & Central AsiaEurope & Central Asia (excluding high income)Europe & Central Asia (IDA & IBRD countries)European UnionFijiFinlandFragile and conflict affected situationsFranceFrench PolynesiaGabonGambia, TheGeorgiaGermanyGhanaGreeceGreenlandGrenadaGuatemalaGuineaGuinea-BissauGuyanaHaitiHeavily indebted poor countries (HIPC)High incomeHondurasHong Kong SAR, ChinaHungaryIBRD onlyIcelandIDA & IBRD totalIDA blendIDA onlyIDA totalIndiaIndonesiaIran, Islamic Rep.IraqIrelandItalyJamaicaJapanJordanKazakhstanKenyaKorea, Dem. People’s Rep.Korea, Rep.KuwaitKyrgyz RepublicLao PDRLate-demographic dividendLatin America & Caribbean Latin America & Caribbean (excluding high income)Latin America & the Caribbean (IDA & IBRD countries)LatviaLeast developed countries: UN classificationLebanonLiberiaLibyaLithuaniaLow & middle incomeLow incomeLower middle incomeLuxembourgMacao SAR, ChinaMacedonia, FYRMadagascarMalawiMalaysiaMaldivesMaliMaltaMauritaniaMauritiusMexicoMiddle East & North AfricaMiddle East & North Africa (excluding high income)Middle East & North Africa (IDA & IBRD countries)Middle incomeMoldovaMongoliaMontenegroMoroccoMozambiqueMyanmarNepalNetherlandsNew CaledoniaNew ZealandNicaraguaNigerNigeriaNorth AmericaNorwayOECD membersOmanOther small statesPacific island small statesPakistanPanamaPapua New GuineaParaguayPeruPhilippinesPolandPortugalPost-demographic dividendPre-demographic dividendQatarRomaniaRussian FederationRwandaSaudi ArabiaSenegalSerbiaSeychellesSierra LeoneSingaporeSlovak RepublicSloveniaSmall statesSomaliaSouth AfricaSouth AsiaSouth Asia (IDA & IBRD)SpainSri LankaSt. LuciaSt. Vincent and the GrenadinesSub-Saharan Africa Sub-Saharan Africa (excluding high income)Sub-Saharan Africa (IDA & IBRD countries)SudanSurinameSwedenSwitzerlandSyrian Arab RepublicTajikistanTanzaniaThailandTogoTrinidad and TobagoTunisiaTurkeyTurkmenistanUgandaUkraineUnited Arab EmiratesUnited KingdomUnited StatesUpper middle incomeUruguayVenezuela, RBVietnamWorldYemen, Rep.ZambiaZimbabwe Linha do tempo:
Nesta escala de tempo está apresentado um gráfico de 1961 ano até 2015 ano Pacific island small states. Dados de 1960 ano ausente. O número de observações reais por data: 55.
Fonte (nome):
Indicadores de desenvolvimento mundial
Fonte (organização):
World Bank staff estimates based data from International Monetary Fund's Direction of Trade database.
Categorias:
Private Sector, Trade
Foi atualizado:
23 abr 2017 ano
Indicadores de alterações dos valores ao longo dos anos
Máximo:
1.298
1 jan 1973 ano
Na data de observação
Valor
Mudança absoluta
A alteração em relação ao valor anterior
1 jan 1961 ano
0.0
0.0
0.0%
1 jan 1965 ano
0.83
+0.83
%
1 jan 1966 ano
0.343
-0.487
-58.65%
1 jan 1967 ano
0.0
-0.343
-100.0%
1 jan 1968 ano
0.233
+0.233
%
1 jan 1969 ano
0.328
+0.095
40.84%
1 jan 1970 ano
0.562
+0.234
71.32%
1 jan 1971 ano
0.514
-0.048
-8.58%
1 jan 1972 ano
1.213
+0.699
135.94%
1 jan 1973 ano
1.298
+0.085
7.02%
1 jan 1974 ano
0.251
-1.047
-80.7%
1 jan 1975 ano
0.055
-0.196
-78.23%
1 jan 1976 ano
0.834
+0.779
1.43 mil%
1 jan 1977 ano
0.099
-0.735
-88.19%
1 jan 1978 ano
0.031
-0.068
-68.58%
1 jan 1979 ano
0.032
+0.001
3.0%
1 jan 1980 ano
0.019
-0.013
-39.82%
1 jan 1981 ano
0.023
+0.004
22.12%
1 jan 1982 ano
0.022
-0.002
-6.61%
1 jan 1983 ano
0.02
-0.002
-7.88%
1 jan 1984 ano
0.026
+0.006
29.21%
1 jan 1985 ano
0.027
+0.001
4.45%
1 jan 1986 ano
0.015
-0.012
-45.07%
1 jan 1987 ano
0.0
-0.015
-100.0%
1 jan 1988 ano
0.019
+0.019
%
1 jan 1989 ano
0.038
+0.02
105.89%
1 jan 1990 ano
0.026
-0.012
-31.36%
1 jan 1991 ano
0.0
-0.026
-100.0%
1 jan 1993 ano
0.01
+0.01
%
1 jan 1994 ano
0.0
-0.01
-100.0%
1 jan 1996 ano
0.003
+0.003
%
1 jan 1997 ano
0.014
+0.012
402.71%
1 jan 1998 ano
0.018
+0.004
27.82%
1 jan 1999 ano
0.002
-0.016
-89.72%
1 jan 2000 ano
0.003
+0.001
71.7%
1 jan 2001 ano
0.002
-0.001
-28.74%
1 jan 2002 ano
0.741
+0.739
32.0 mil%
1 jan 2003 ano
0.097
-0.644
-86.89%
1 jan 2004 ano
0.0
-0.097
-100.0%
1 jan 2005 ano
0.0
0.0
-0.72%
1 jan 2006 ano
0.005
+0.005
148.26 mil%
1 jan 2007 ano
0.006
+0.001
27.35%
1 jan 2008 ano
0.002
-0.004
-68.1%
1 jan 2009 ano
0.004
+0.001
72.91%
1 jan 2010 ano
0.011
+0.007
206.93%
1 jan 2011 ano
0.023
+0.012
110.5%
1 jan 2012 ano
0.013
-0.01
-41.86%
1 jan 2013 ano
0.038
+0.024
181.46%
1 jan 2014 ano
0.02
-0.018
-47.62%
1 jan 2015 ano
0.082
+0.063
319.2%
Classificação de países por estatísticas atuais por anos


Comentários: