29
/pt/
pt
AIzaSyAYiBZKx7MnpbEhh9jyipgxe19OcubqV5w
April 1, 2024
257563
Switzerland
CHE
true
2
1
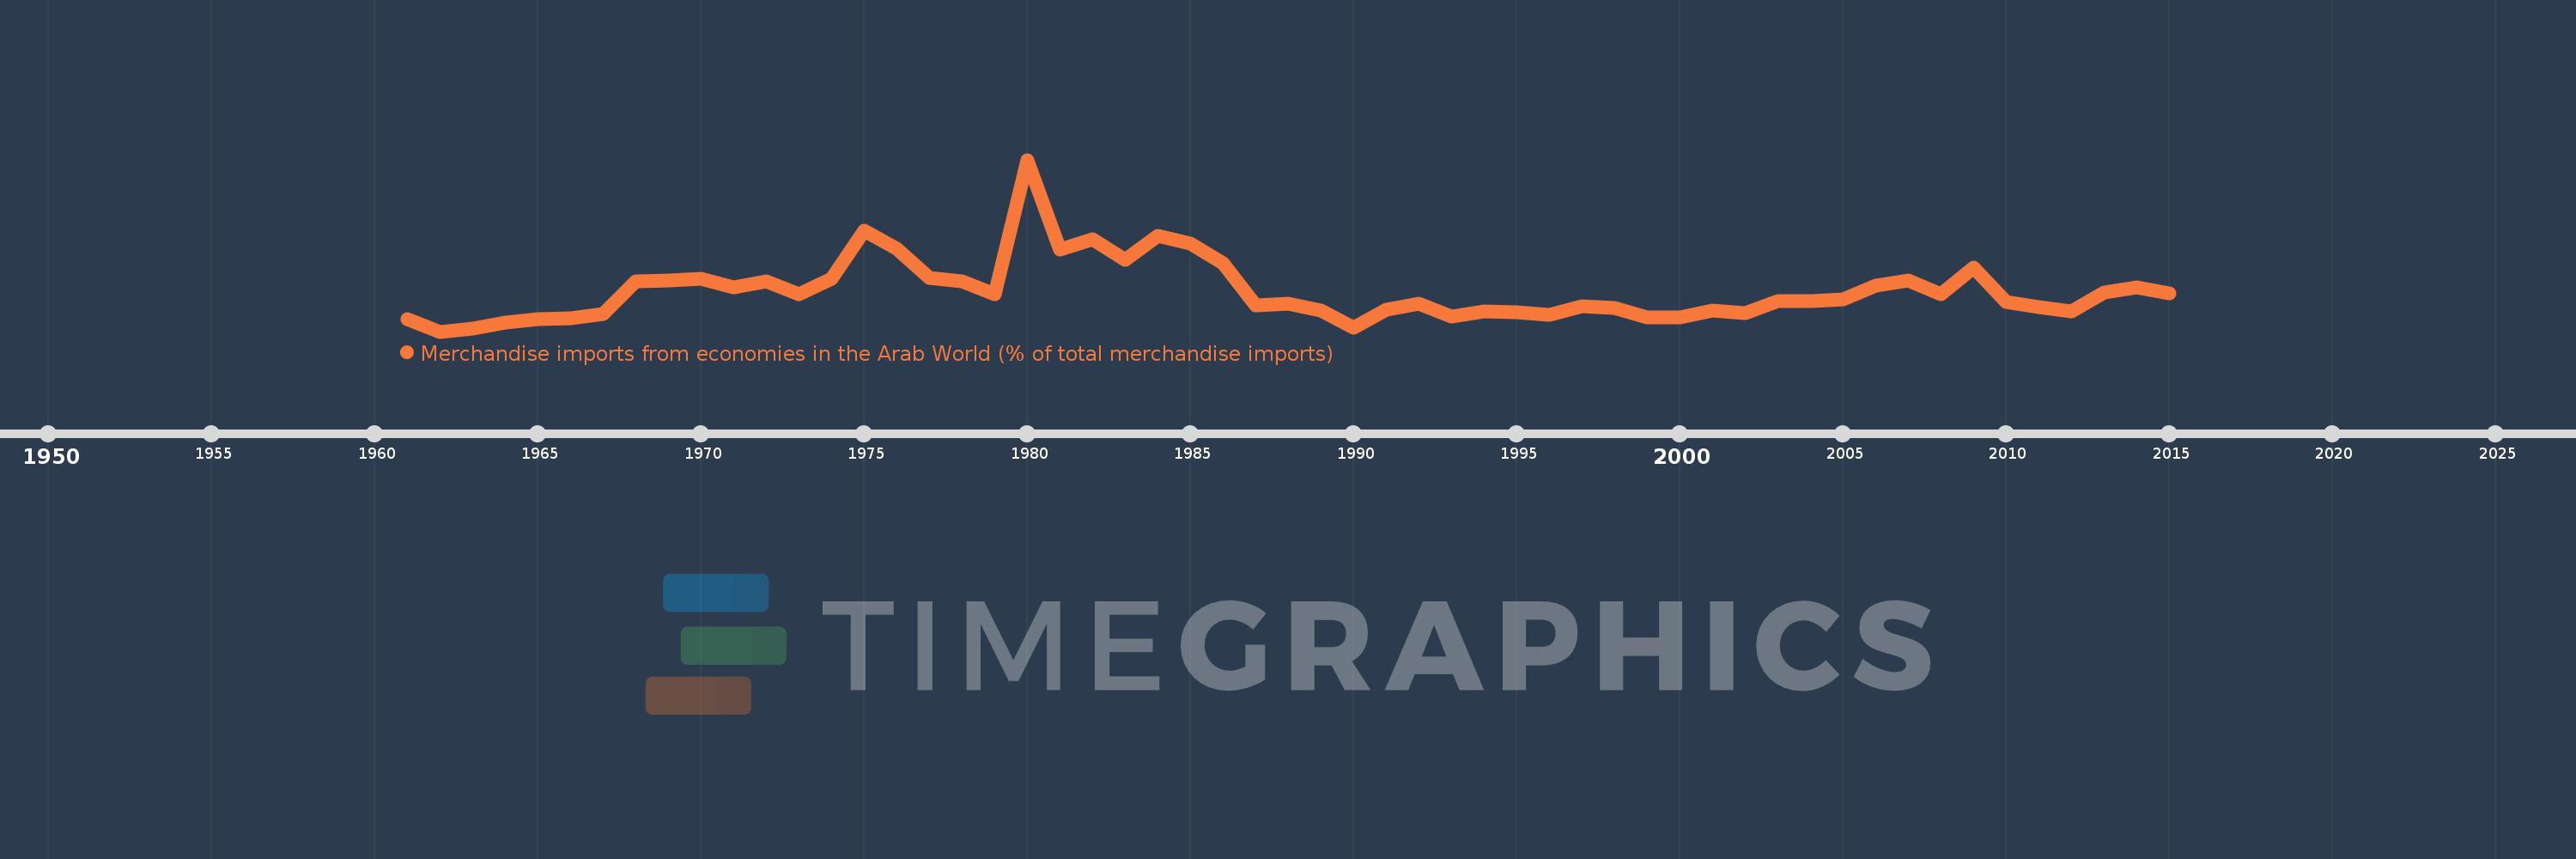
Merchandise imports from economies in the Arab World (% of total merchandise imports)
2015,2014,2013,2012,2011,2010,2009,2008,2007,2006,2005,2004,2003,2002,2001,2000,1999,1998,1997,1996,1995,1994,1993,1992,1991,1990,1989,1988,1987,1986,1985,1984,1983,1982,1981,1980,1979,1978,1977,1976,1975,1974,1973,1972,1971,1970,1969,1968,1967,1966,1965,1964,1963,1962,1961
Estas estatísticas em outros países:
AfghanistanAlbaniaAlgeriaAngolaArab WorldArgentinaArmeniaArubaAustraliaAustriaAzerbaijanBahamas, TheBahrainBangladeshBarbadosBelarusBelgiumBelizeBeninBermudaBoliviaBrazilBrunei DarussalamBulgariaBurkina FasoBurundiCabo VerdeCambodiaCameroonCanadaCaribbean small statesCentral African RepublicCentral Europe and the BalticsChadChileChinaColombiaComorosCongo, Dem. Rep.Congo, Rep.Costa RicaCote d'IvoireCroatiaCubaCyprusCzech RepublicDenmarkDjiboutiDominicaDominican RepublicEarly-demographic dividendEast Asia & PacificEast Asia & Pacific (excluding high income)East Asia & Pacific (IDA & IBRD countries)EcuadorEgypt, Arab Rep.El SalvadorEstoniaEthiopiaEuro areaEurope & Central AsiaEurope & Central Asia (excluding high income)Europe & Central Asia (IDA & IBRD countries)European UnionFijiFinlandFragile and conflict affected situationsFranceFrench PolynesiaGabonGambia, TheGeorgiaGermanyGhanaGreeceGreenlandGrenadaGuatemalaGuineaGuinea-BissauGuyanaHaitiHeavily indebted poor countries (HIPC)High incomeHondurasHong Kong SAR, ChinaHungaryIBRD onlyIcelandIDA & IBRD totalIDA blendIDA onlyIDA totalIndiaIndonesiaIran, Islamic Rep.IraqIrelandItalyJamaicaJapanJordanKazakhstanKenyaKorea, Dem. People’s Rep.Korea, Rep.KuwaitKyrgyz RepublicLao PDRLate-demographic dividendLatin America & Caribbean Latin America & Caribbean (excluding high income)Latin America & the Caribbean (IDA & IBRD countries)LatviaLeast developed countries: UN classificationLebanonLiberiaLibyaLithuaniaLow & middle incomeLow incomeLower middle incomeLuxembourgMacao SAR, ChinaMacedonia, FYRMadagascarMalawiMalaysiaMaldivesMaliMaltaMauritaniaMauritiusMexicoMiddle East & North AfricaMiddle East & North Africa (excluding high income)Middle East & North Africa (IDA & IBRD countries)Middle incomeMoldovaMongoliaMontenegroMoroccoMozambiqueMyanmarNepalNetherlandsNew CaledoniaNew ZealandNicaraguaNigerNigeriaNorth AmericaNorwayOECD membersOmanOther small statesPacific island small statesPakistanPanamaPapua New GuineaParaguayPeruPhilippinesPolandPortugalPost-demographic dividendPre-demographic dividendQatarRomaniaRussian FederationRwandaSaudi ArabiaSenegalSerbiaSeychellesSierra LeoneSingaporeSlovak RepublicSloveniaSmall statesSomaliaSouth AfricaSouth AsiaSouth Asia (IDA & IBRD)SpainSri LankaSt. LuciaSt. Vincent and the GrenadinesSub-Saharan Africa Sub-Saharan Africa (excluding high income)Sub-Saharan Africa (IDA & IBRD countries)SudanSurinameSwedenSwitzerlandSyrian Arab RepublicTajikistanTanzaniaThailandTogoTrinidad and TobagoTunisiaTurkeyTurkmenistanUgandaUkraineUnited Arab EmiratesUnited KingdomUnited StatesUpper middle incomeUruguayVenezuela, RBVietnamWorldYemen, Rep.ZambiaZimbabwe Linha do tempo:
Nesta escala de tempo está apresentado um gráfico de 1961 ano até 2015 ano Switzerland. Dados de 1960 ano ausente. O número de observações reais por data: 55.
Fonte (nome):
Indicadores de desenvolvimento mundial
Fonte (organização):
World Bank staff estimates based data from International Monetary Fund's Direction of Trade database.
Categorias:
Private Sector, Trade
Foi atualizado:
23 abr 2017 ano
Indicadores de alterações dos valores ao longo dos anos
Mínimo:
0.468
1 jan 1962 ano
Máximo:
5.858
1 jan 1980 ano
Na data de observação
Valor
Mudança absoluta
A alteração em relação ao valor anterior
1 jan 1961 ano
0.846
+0.846
0.0%
1 jan 1962 ano
0.468
-0.378
-44.68%
1 jan 1963 ano
0.549
+0.081
17.32%
1 jan 1964 ano
0.745
+0.195
35.58%
1 jan 1965 ano
0.851
+0.106
14.22%
1 jan 1966 ano
0.884
+0.034
3.96%
1 jan 1967 ano
1.016
+0.131
14.87%
1 jan 1968 ano
2.047
+1.032
101.57%
1 jan 1969 ano
2.077
+0.03
1.46%
1 jan 1970 ano
2.124
+0.047
2.26%
1 jan 1971 ano
1.854
-0.27
-12.71%
1 jan 1972 ano
2.044
+0.19
10.23%
1 jan 1973 ano
1.646
-0.398
-19.49%
1 jan 1974 ano
2.138
+0.492
29.9%
1 jan 1975 ano
3.639
+1.501
70.21%
1 jan 1976 ano
3.078
-0.561
-15.41%
1 jan 1977 ano
2.148
-0.931
-30.24%
1 jan 1978 ano
2.04
-0.108
-5.02%
1 jan 1979 ano
1.651
-0.389
-19.07%
1 jan 1980 ano
5.858
+4.208
254.92%
1 jan 1981 ano
3.048
-2.811
-47.98%
1 jan 1982 ano
3.377
+0.329
10.8%
1 jan 1983 ano
2.731
-0.646
-19.12%
1 jan 1984 ano
3.472
+0.741
27.13%
1 jan 1985 ano
3.224
-0.248
-7.15%
1 jan 1986 ano
2.62
-0.603
-18.71%
1 jan 1987 ano
1.297
-1.324
-50.52%
1 jan 1988 ano
1.352
+0.056
4.3%
1 jan 1989 ano
1.122
-0.23
-17.03%
1 jan 1990 ano
0.58
-0.542
-48.32%
1 jan 1991 ano
1.158
+0.578
99.76%
1 jan 1992 ano
1.354
+0.195
16.88%
1 jan 1993 ano
0.949
-0.404
-29.87%
1 jan 1994 ano
1.092
+0.142
14.98%
1 jan 1995 ano
1.07
-0.021
-1.93%
1 jan 1996 ano
0.996
-0.074
-6.92%
1 jan 1997 ano
1.267
+0.271
27.18%
1 jan 1998 ano
1.221
-0.047
-3.68%
1 jan 1999 ano
0.916
-0.304
-24.93%
1 jan 2000 ano
0.908
-0.008
-0.93%
1 jan 2001 ano
1.136
+0.228
25.08%
1 jan 2002 ano
1.044
-0.092
-8.09%
1 jan 2003 ano
1.433
+0.389
37.26%
1 jan 2004 ano
1.419
-0.013
-0.92%
1 jan 2005 ano
1.479
+0.06
4.22%
1 jan 2006 ano
1.923
+0.444
30.01%
1 jan 2007 ano
2.085
+0.161
8.4%
1 jan 2008 ano
1.63
-0.455
-21.83%
1 jan 2009 ano
2.479
+0.85
52.14%
1 jan 2010 ano
1.389
-1.091
-43.99%
1 jan 2011 ano
1.241
-0.148
-10.66%
1 jan 2012 ano
1.091
-0.15
-12.07%
1 jan 2013 ano
1.685
+0.594
54.47%
1 jan 2014 ano
1.852
+0.167
9.92%
1 jan 2015 ano
1.656
-0.196
-10.6%
Classificação de países por estatísticas atuais por anos


Comentários: