29
/pt/
pt
AIzaSyAYiBZKx7MnpbEhh9jyipgxe19OcubqV5w
April 1, 2024
35946
High income
HIC
false
2
1
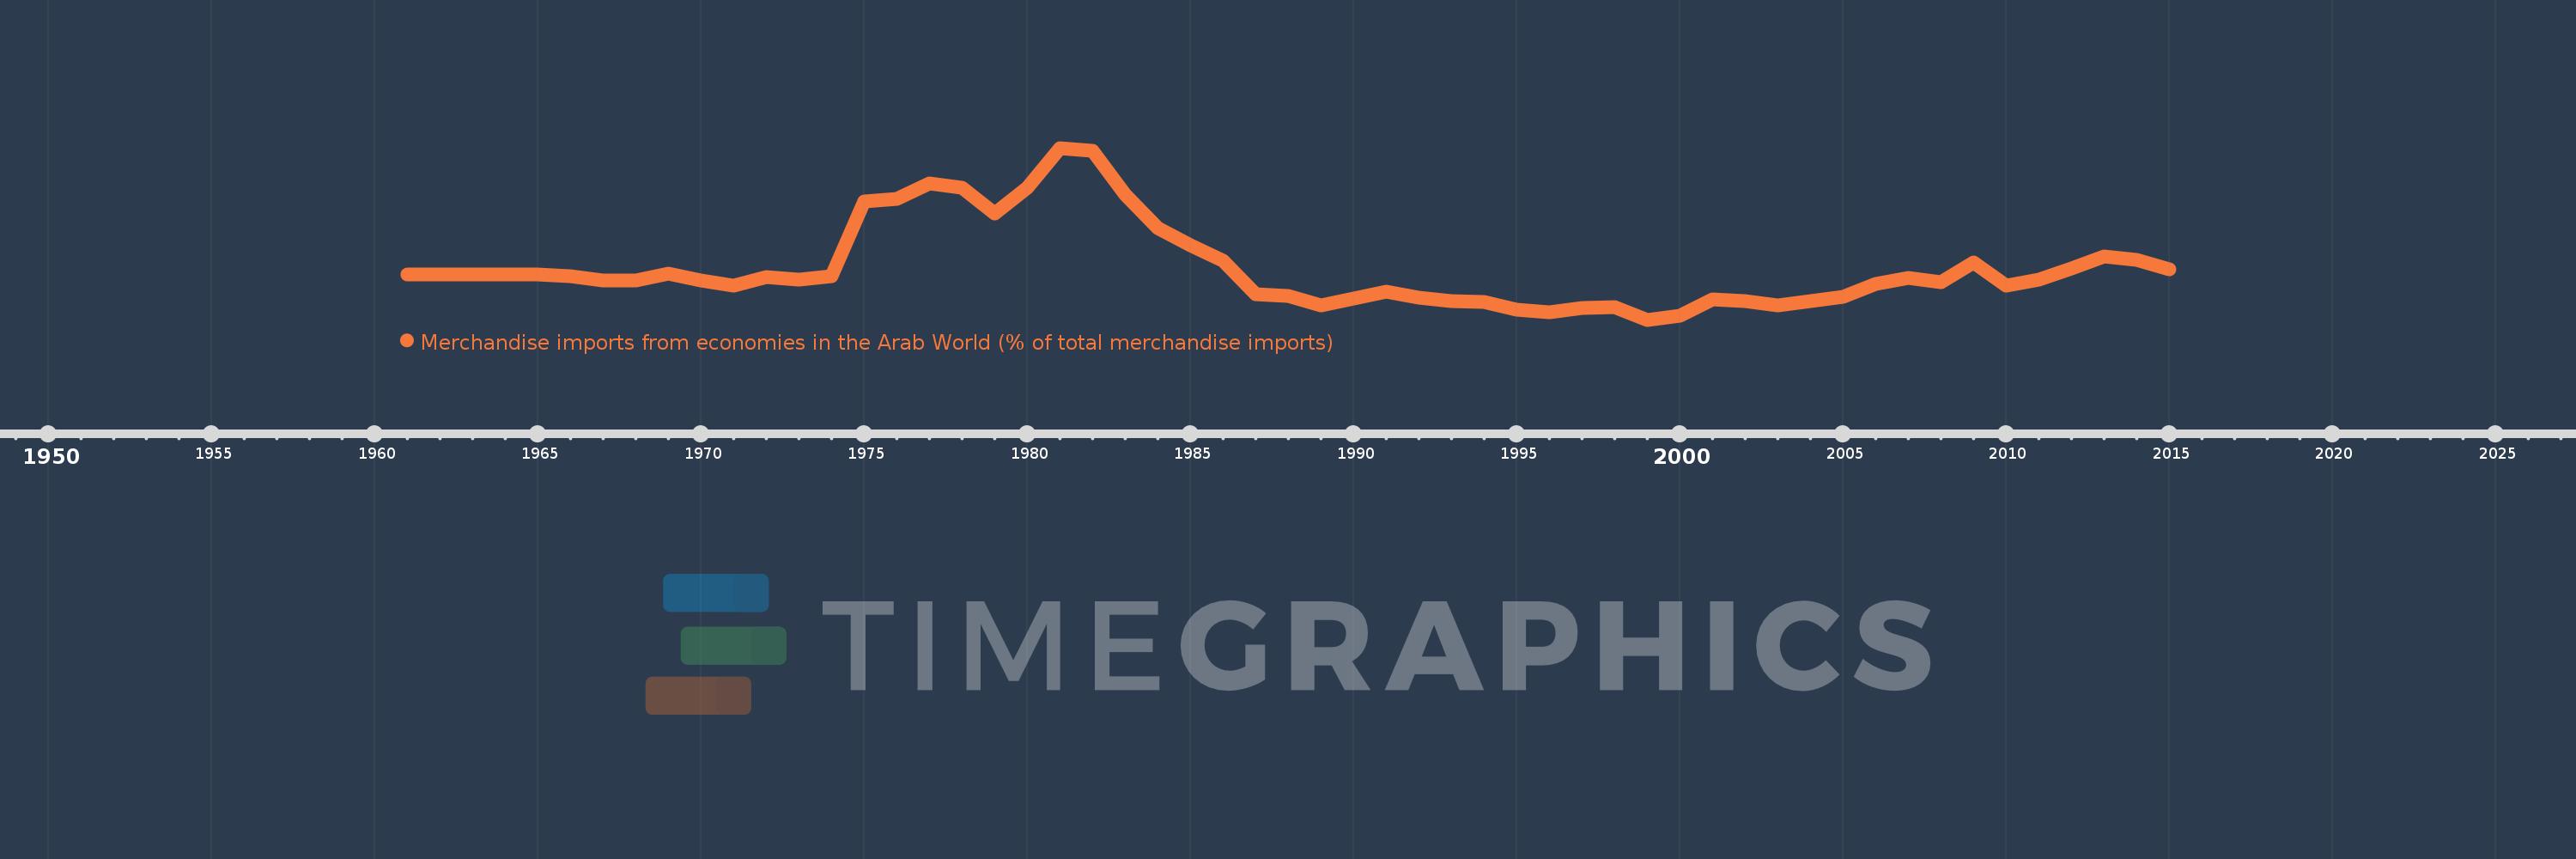
Merchandise imports from economies in the Arab World (% of total merchandise imports)
2015,2014,2013,2012,2011,2010,2009,2008,2007,2006,2005,2004,2003,2002,2001,2000,1999,1998,1997,1996,1995,1994,1993,1992,1991,1990,1989,1988,1987,1986,1985,1984,1983,1982,1981,1980,1979,1978,1977,1976,1975,1974,1973,1972,1971,1970,1969,1968,1967,1966,1965,1964,1963,1962,1961
Estas estatísticas em outros países:
AfghanistanAlbaniaAlgeriaAngolaArab WorldArgentinaArmeniaArubaAustraliaAustriaAzerbaijanBahamas, TheBahrainBangladeshBarbadosBelarusBelgiumBelizeBeninBermudaBoliviaBrazilBrunei DarussalamBulgariaBurkina FasoBurundiCabo VerdeCambodiaCameroonCanadaCaribbean small statesCentral African RepublicCentral Europe and the BalticsChadChileChinaColombiaComorosCongo, Dem. Rep.Congo, Rep.Costa RicaCote d'IvoireCroatiaCubaCyprusCzech RepublicDenmarkDjiboutiDominicaDominican RepublicEarly-demographic dividendEast Asia & PacificEast Asia & Pacific (excluding high income)East Asia & Pacific (IDA & IBRD countries)EcuadorEgypt, Arab Rep.El SalvadorEstoniaEthiopiaEuro areaEurope & Central AsiaEurope & Central Asia (excluding high income)Europe & Central Asia (IDA & IBRD countries)European UnionFijiFinlandFragile and conflict affected situationsFranceFrench PolynesiaGabonGambia, TheGeorgiaGermanyGhanaGreeceGreenlandGrenadaGuatemalaGuineaGuinea-BissauGuyanaHaitiHeavily indebted poor countries (HIPC)High incomeHondurasHong Kong SAR, ChinaHungaryIBRD onlyIcelandIDA & IBRD totalIDA blendIDA onlyIDA totalIndiaIndonesiaIran, Islamic Rep.IraqIrelandItalyJamaicaJapanJordanKazakhstanKenyaKorea, Dem. People’s Rep.Korea, Rep.KuwaitKyrgyz RepublicLao PDRLate-demographic dividendLatin America & Caribbean Latin America & Caribbean (excluding high income)Latin America & the Caribbean (IDA & IBRD countries)LatviaLeast developed countries: UN classificationLebanonLiberiaLibyaLithuaniaLow & middle incomeLow incomeLower middle incomeLuxembourgMacao SAR, ChinaMacedonia, FYRMadagascarMalawiMalaysiaMaldivesMaliMaltaMauritaniaMauritiusMexicoMiddle East & North AfricaMiddle East & North Africa (excluding high income)Middle East & North Africa (IDA & IBRD countries)Middle incomeMoldovaMongoliaMontenegroMoroccoMozambiqueMyanmarNepalNetherlandsNew CaledoniaNew ZealandNicaraguaNigerNigeriaNorth AmericaNorwayOECD membersOmanOther small statesPacific island small statesPakistanPanamaPapua New GuineaParaguayPeruPhilippinesPolandPortugalPost-demographic dividendPre-demographic dividendQatarRomaniaRussian FederationRwandaSaudi ArabiaSenegalSerbiaSeychellesSierra LeoneSingaporeSlovak RepublicSloveniaSmall statesSomaliaSouth AfricaSouth AsiaSouth Asia (IDA & IBRD)SpainSri LankaSt. LuciaSt. Vincent and the GrenadinesSub-Saharan Africa Sub-Saharan Africa (excluding high income)Sub-Saharan Africa (IDA & IBRD countries)SudanSurinameSwedenSwitzerlandSyrian Arab RepublicTajikistanTanzaniaThailandTogoTrinidad and TobagoTunisiaTurkeyTurkmenistanUgandaUkraineUnited Arab EmiratesUnited KingdomUnited StatesUpper middle incomeUruguayVenezuela, RBVietnamWorldYemen, Rep.ZambiaZimbabwe Linha do tempo:
Nesta escala de tempo está apresentado um gráfico de 1961 ano até 2015 ano High income. Dados de 1960 ano ausente. O número de observações reais por data: 55.
Fonte (nome):
Indicadores de desenvolvimento mundial
Fonte (organização):
World Bank staff estimates based data from International Monetary Fund's Direction of Trade database.
Categorias:
Private Sector, Trade
Foi atualizado:
23 abr 2017 ano
Indicadores de alterações dos valores ao longo dos anos
Mínimo:
2.51
1 jan 1999 ano
Máximo:
12.94
1 jan 1981 ano
Na data de observação
Valor
Mudança absoluta
A alteração em relação ao valor anterior
1 jan 1961 ano
5.258
+5.258
0.0%
1 jan 1962 ano
5.241
-0.017
-0.32%
1 jan 1963 ano
5.25
+0.009
0.18%
1 jan 1964 ano
5.282
+0.032
0.62%
1 jan 1965 ano
5.282
-0.001
-0.02%
1 jan 1966 ano
5.157
-0.124
-2.36%
1 jan 1967 ano
4.888
-0.269
-5.21%
1 jan 1968 ano
4.906
+0.018
0.36%
1 jan 1969 ano
5.313
+0.407
8.29%
1 jan 1970 ano
4.888
-0.425
-8.0%
1 jan 1971 ano
4.605
-0.283
-5.78%
1 jan 1972 ano
5.108
+0.502
10.91%
1 jan 1973 ano
4.943
-0.165
-3.23%
1 jan 1974 ano
5.165
+0.223
4.51%
1 jan 1975 ano
9.717
+4.552
88.13%
1 jan 1976 ano
9.862
+0.145
1.49%
1 jan 1977 ano
10.8
+0.938
9.52%
1 jan 1978 ano
10.548
-0.253
-2.34%
1 jan 1979 ano
8.946
-1.602
-15.19%
1 jan 1980 ano
10.547
+1.601
17.89%
1 jan 1981 ano
12.94
+2.394
22.7%
1 jan 1982 ano
12.776
-0.164
-1.27%
1 jan 1983 ano
10.116
-2.661
-20.83%
1 jan 1984 ano
8.1
-2.016
-19.93%
1 jan 1985 ano
7.008
-1.092
-13.48%
1 jan 1986 ano
6.082
-0.927
-13.22%
1 jan 1987 ano
4.061
-2.021
-33.22%
1 jan 1988 ano
3.979
-0.082
-2.03%
1 jan 1989 ano
3.39
-0.589
-14.8%
1 jan 1990 ano
3.775
+0.385
11.36%
1 jan 1991 ano
4.236
+0.461
12.21%
1 jan 1992 ano
3.873
-0.363
-8.57%
1 jan 1993 ano
3.655
-0.218
-5.62%
1 jan 1994 ano
3.573
-0.082
-2.26%
1 jan 1995 ano
3.136
-0.437
-12.24%
1 jan 1996 ano
2.976
-0.159
-5.08%
1 jan 1997 ano
3.237
+0.261
8.78%
1 jan 1998 ano
3.262
+0.024
0.75%
1 jan 1999 ano
2.51
-0.752
-23.05%
1 jan 2000 ano
2.775
+0.265
10.55%
1 jan 2001 ano
3.748
+0.973
35.06%
1 jan 2002 ano
3.652
-0.096
-2.55%
1 jan 2003 ano
3.39
-0.262
-7.18%
1 jan 2004 ano
3.625
+0.235
6.93%
1 jan 2005 ano
3.882
+0.258
7.11%
1 jan 2006 ano
4.696
+0.814
20.96%
1 jan 2007 ano
5.028
+0.332
7.07%
1 jan 2008 ano
4.795
-0.233
-4.64%
1 jan 2009 ano
6.008
+1.213
25.29%
1 jan 2010 ano
4.604
-1.404
-23.36%
1 jan 2011 ano
4.949
+0.345
7.5%
1 jan 2012 ano
5.604
+0.655
13.23%
1 jan 2013 ano
6.336
+0.731
13.05%
1 jan 2014 ano
6.122
-0.214
-3.38%
1 jan 2015 ano
5.595
-0.527
-8.6%
Classificação de países por estatísticas atuais por anos


Comentários: