29
/pt/
pt
AIzaSyAYiBZKx7MnpbEhh9jyipgxe19OcubqV5w
April 1, 2024
86981
Bolivia
BOL
true
2
1
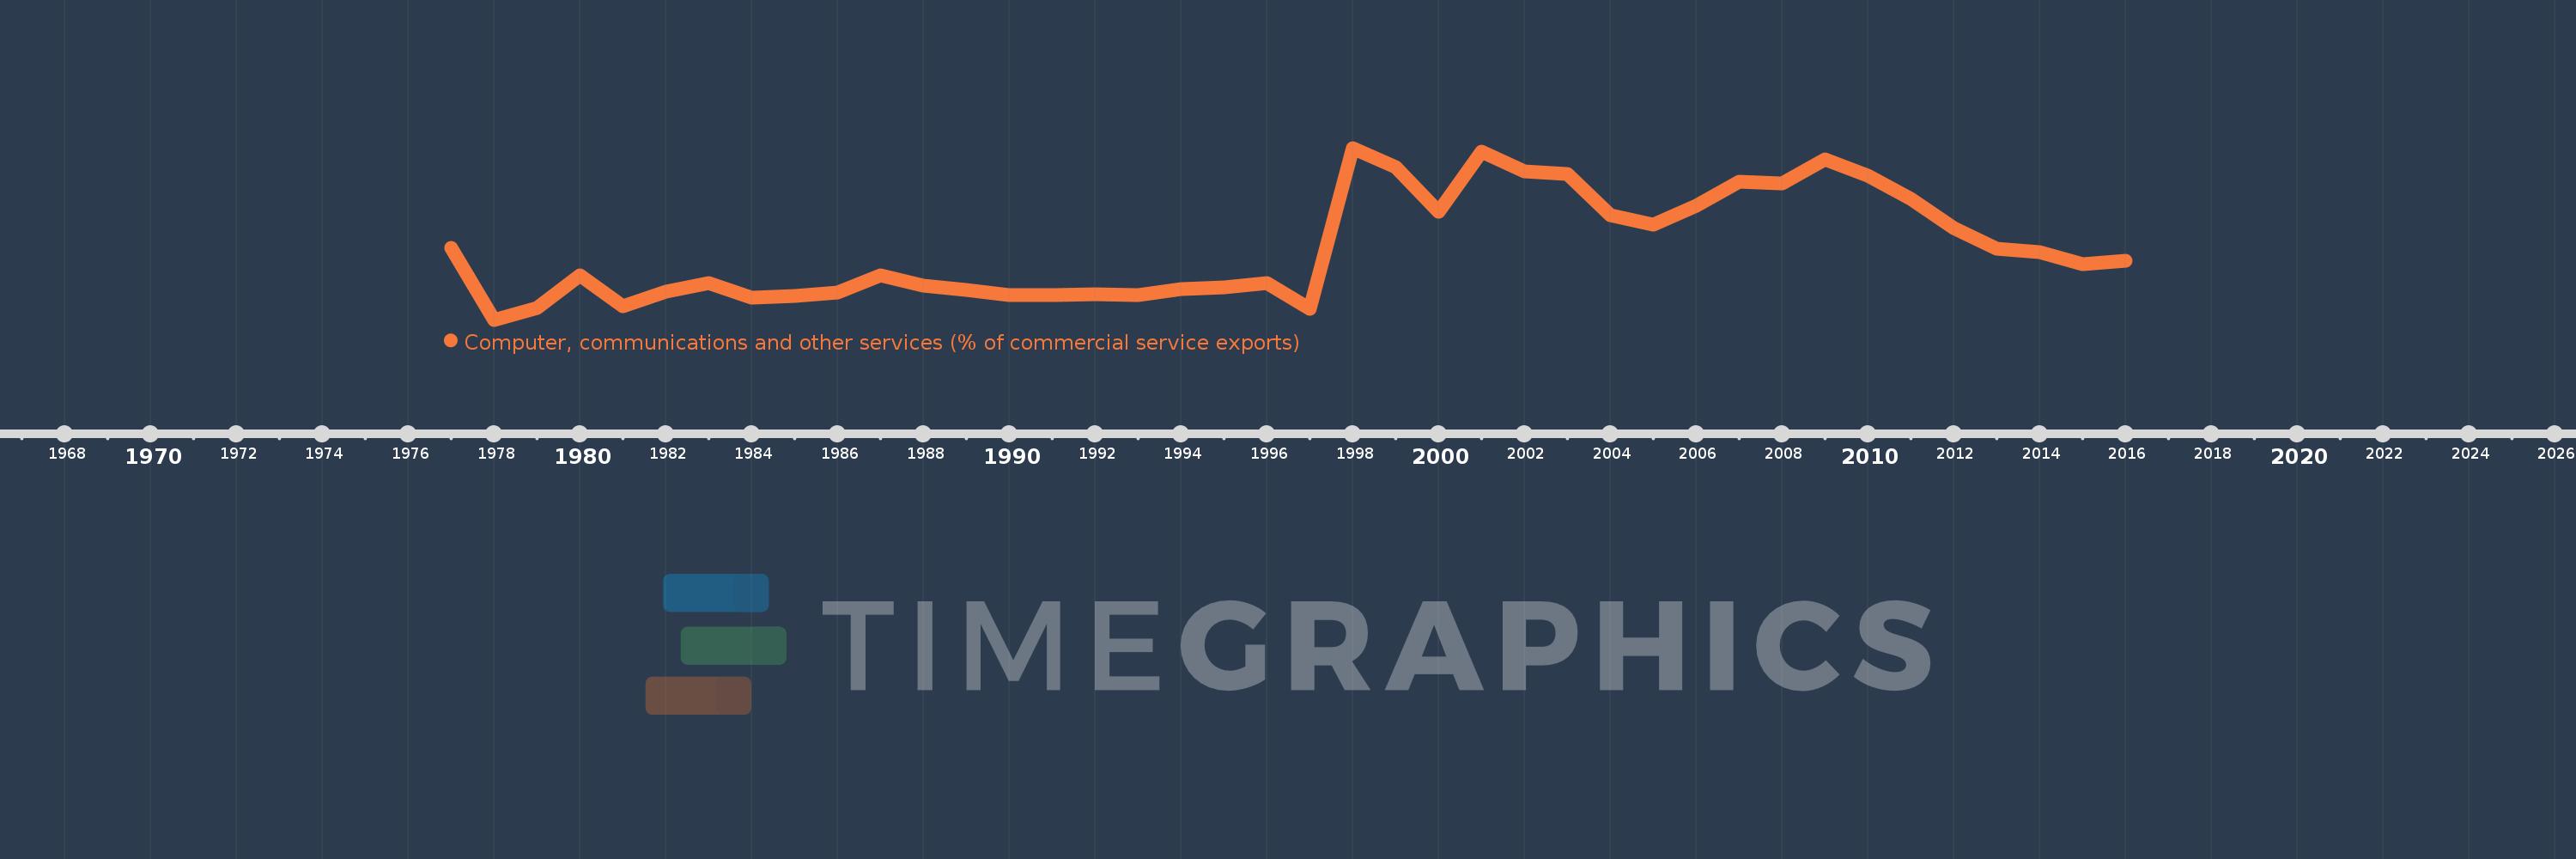
Computer, communications and other services (% of commercial service exports)
2016,2015,2014,2013,2012,2011,2010,2009,2008,2007,2006,2005,2004,2003,2002,2001,2000,1999,1998,1997,1996,1995,1994,1993,1992,1991,1990,1989,1988,1987,1986,1985,1984,1983,1982,1981,1980,1979,1978,1977
Estas estatísticas em outros países:
AfghanistanAlbaniaAlgeriaAngolaAntigua and BarbudaArab WorldArgentinaArmeniaArubaAustraliaAustriaAzerbaijanBahamas, TheBahrainBangladeshBarbadosBelarusBelgiumBelizeBeninBermudaBhutanBoliviaBosnia and HerzegovinaBotswanaBrazilBrunei DarussalamBulgariaBurkina FasoBurundiCabo VerdeCambodiaCameroonCanadaCaribbean small statesCentral African RepublicCentral Europe and the BalticsChadChileChinaColombiaComorosCongo, Dem. Rep.Congo, Rep.Costa RicaCote d'IvoireCroatiaCuracaoCyprusCzech RepublicDenmarkDjiboutiDominicaDominican RepublicEarly-demographic dividendEast Asia & PacificEast Asia & Pacific (excluding high income)East Asia & Pacific (IDA & IBRD countries)EcuadorEgypt, Arab Rep.El SalvadorEritreaEstoniaEthiopiaEuro areaEurope & Central AsiaEurope & Central Asia (excluding high income)Europe & Central Asia (IDA & IBRD countries)European UnionFaroe IslandsFijiFinlandFragile and conflict affected situationsFranceFrench PolynesiaGabonGambia, TheGeorgiaGermanyGhanaGreeceGrenadaGuatemalaGuineaGuinea-BissauGuyanaHaitiHeavily indebted poor countries (HIPC)High incomeHondurasHong Kong SAR, ChinaHungaryIBRD onlyIcelandIDA & IBRD totalIDA onlyIDA totalIndiaIndonesiaIran, Islamic Rep.IraqIrelandIsraelItalyJamaicaJapanJordanKazakhstanKenyaKiribatiKorea, Rep.KosovoKuwaitKyrgyz RepublicLao PDRLate-demographic dividendLatin America & Caribbean Latin America & Caribbean (excluding high income)Latin America & the Caribbean (IDA & IBRD countries)LatviaLeast developed countries: UN classificationLebanonLesothoLiberiaLibyaLithuaniaLow & middle incomeLow incomeLower middle incomeLuxembourgMacao SAR, ChinaMacedonia, FYRMadagascarMalawiMalaysiaMaldivesMaliMaltaMarshall IslandsMauritaniaMauritiusMexicoMicronesia, Fed. Sts.Middle East & North AfricaMiddle East & North Africa (excluding high income)Middle East & North Africa (IDA & IBRD countries)Middle incomeMoldovaMongoliaMontenegroMoroccoMozambiqueMyanmarNamibiaNepalNetherlandsNew CaledoniaNew ZealandNicaraguaNigerNigeriaNorth AmericaNorwayOECD membersOmanOther small statesPacific island small statesPakistanPalauPanamaPapua New GuineaParaguayPeruPhilippinesPolandPortugalPost-demographic dividendPre-demographic dividendQatarRomaniaRussian FederationRwandaSamoaSao Tome and PrincipeSaudi ArabiaSenegalSerbiaSeychellesSierra LeoneSingaporeSint Maarten (Dutch part)Slovak RepublicSloveniaSmall statesSolomon IslandsSouth AfricaSouth AsiaSouth Asia (IDA & IBRD)South SudanSpainSri LankaSt. Kitts and NevisSt. LuciaSt. Vincent and the GrenadinesSub-Saharan Africa Sub-Saharan Africa (excluding high income)Sub-Saharan Africa (IDA & IBRD countries)SudanSurinameSwazilandSwedenSwitzerlandSyrian Arab RepublicTajikistanTanzaniaThailandTimor-LesteTogoTongaTrinidad and TobagoTunisiaTurkeyTuvaluUgandaUkraineUnited KingdomUnited StatesUpper middle incomeUruguayVanuatuVenezuela, RBWest Bank and GazaWorldYemen, Rep.ZambiaZimbabwe Linha do tempo:
Nesta escala de tempo está apresentado um gráfico de 1977 ano até 2016 ano Bolivia. Dados de 1976 ano ausente. O número de observações reais por data: 40.
Fonte (nome):
Indicadores de desenvolvimento mundial
Fonte (organização):
International Monetary Fund, Balance of Payments Statistics Yearbook and data files.
Categorias:
Private Sector, Trade
Foi atualizado:
23 abr 2017 ano
Indicadores de alterações dos valores ao longo dos anos
Mínimo:
4.44
1 jan 1978 ano
Máximo:
48.341
1 jan 1998 ano
Na data de observação
Valor
Mudança absoluta
A alteração em relação ao valor anterior
1 jan 1977 ano
22.71
+22.71
0.0%
1 jan 1978 ano
4.44
-18.27
-80.45%
1 jan 1979 ano
7.463
+3.023
68.07%
1 jan 1980 ano
15.795
+8.332
111.65%
1 jan 1981 ano
7.799
-7.996
-50.63%
1 jan 1982 ano
11.529
+3.731
47.84%
1 jan 1983 ano
13.863
+2.333
20.24%
1 jan 1984 ano
10.0
-3.863
-27.86%
1 jan 1985 ano
10.526
+0.526
5.26%
1 jan 1986 ano
11.429
+0.902
8.57%
1 jan 1987 ano
15.751
+4.322
37.82%
1 jan 1988 ano
13.062
-2.689
-17.07%
1 jan 1989 ano
11.986
-1.075
-8.23%
1 jan 1990 ano
10.821
-1.165
-9.72%
1 jan 1991 ano
10.633
-0.188
-1.73%
1 jan 1992 ano
10.964
+0.33
3.11%
1 jan 1993 ano
10.726
-0.238
-2.17%
1 jan 1994 ano
12.334
+1.608
14.99%
1 jan 1995 ano
12.606
+0.272
2.21%
1 jan 1996 ano
13.876
+1.27
10.08%
1 jan 1997 ano
7.187
-6.689
-48.2%
1 jan 1998 ano
48.341
+41.154
572.58%
1 jan 1999 ano
43.41
-4.931
-10.2%
1 jan 2000 ano
32.042
-11.369
-26.19%
1 jan 2001 ano
47.363
+15.321
47.82%
1 jan 2002 ano
42.321
-5.042
-10.64%
1 jan 2003 ano
41.592
-0.729
-1.72%
1 jan 2004 ano
31.214
-10.378
-24.95%
1 jan 2005 ano
28.843
-2.371
-7.6%
1 jan 2006 ano
33.624
+4.781
16.58%
1 jan 2007 ano
39.654
+6.03
17.93%
1 jan 2008 ano
39.213
-0.441
-1.11%
1 jan 2009 ano
45.355
+6.142
15.66%
1 jan 2010 ano
41.191
-4.165
-9.18%
1 jan 2011 ano
35.366
-5.825
-14.14%
1 jan 2012 ano
27.915
-7.451
-21.07%
1 jan 2013 ano
22.669
-5.246
-18.79%
1 jan 2014 ano
21.671
-0.998
-4.4%
1 jan 2015 ano
18.704
-2.967
-13.69%
1 jan 2016 ano
19.502
+0.799
4.27%
Classificação de países por estatísticas atuais por anos


Comentários: