29
/pt/
pt
AIzaSyAYiBZKx7MnpbEhh9jyipgxe19OcubqV5w
April 1, 2024
62461
World
WLD
false
2
1
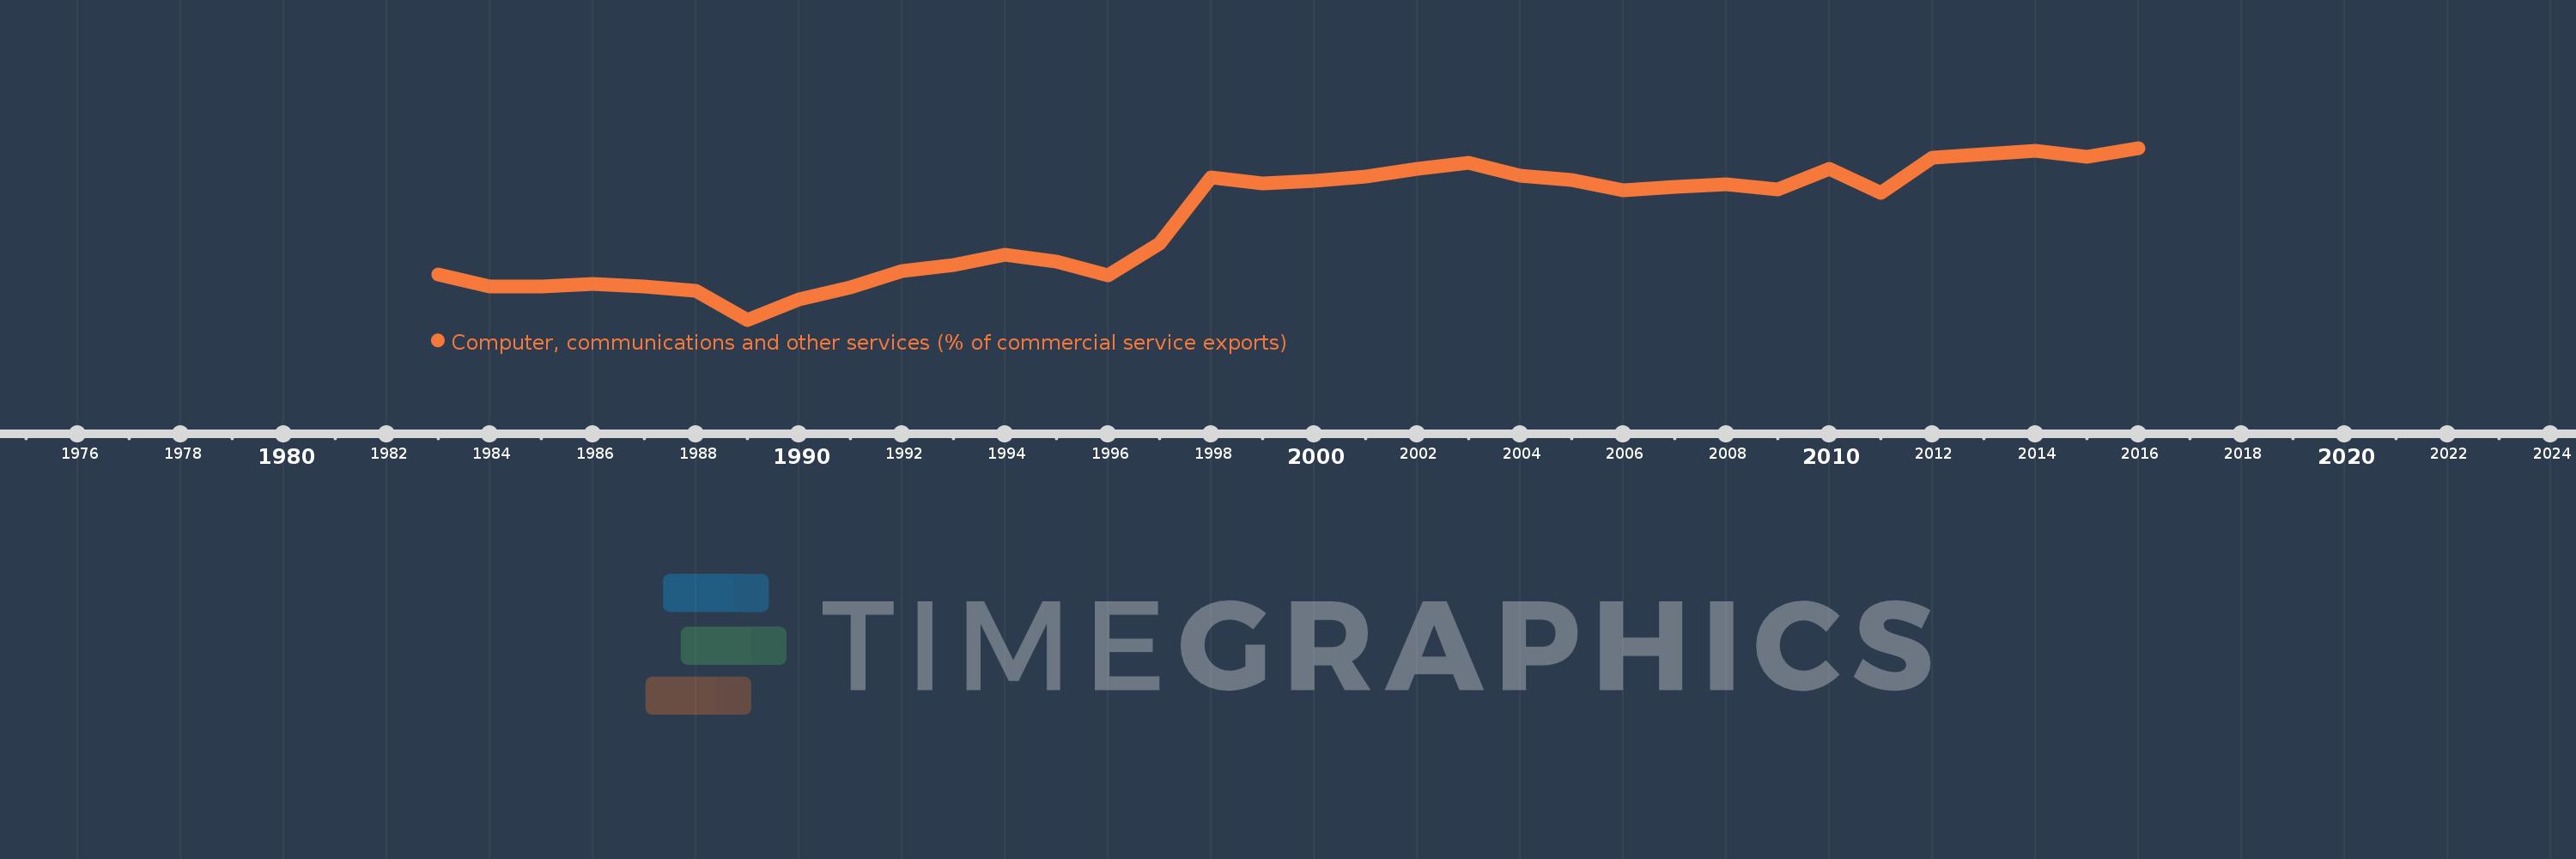
Computer, communications and other services (% of commercial service exports)
2016,2015,2014,2013,2012,2011,2010,2009,2008,2007,2006,2005,2004,2003,2002,2001,2000,1999,1998,1997,1996,1995,1994,1993,1992,1991,1990,1989,1988,1987,1986,1985,1984,1983
Estas estatísticas em outros países:
AfghanistanAlbaniaAlgeriaAngolaAntigua and BarbudaArab WorldArgentinaArmeniaArubaAustraliaAustriaAzerbaijanBahamas, TheBahrainBangladeshBarbadosBelarusBelgiumBelizeBeninBermudaBhutanBoliviaBosnia and HerzegovinaBotswanaBrazilBrunei DarussalamBulgariaBurkina FasoBurundiCabo VerdeCambodiaCameroonCanadaCaribbean small statesCentral African RepublicCentral Europe and the BalticsChadChileChinaColombiaComorosCongo, Dem. Rep.Congo, Rep.Costa RicaCote d'IvoireCroatiaCuracaoCyprusCzech RepublicDenmarkDjiboutiDominicaDominican RepublicEarly-demographic dividendEast Asia & PacificEast Asia & Pacific (excluding high income)East Asia & Pacific (IDA & IBRD countries)EcuadorEgypt, Arab Rep.El SalvadorEritreaEstoniaEthiopiaEuro areaEurope & Central AsiaEurope & Central Asia (excluding high income)Europe & Central Asia (IDA & IBRD countries)European UnionFaroe IslandsFijiFinlandFragile and conflict affected situationsFranceFrench PolynesiaGabonGambia, TheGeorgiaGermanyGhanaGreeceGrenadaGuatemalaGuineaGuinea-BissauGuyanaHaitiHeavily indebted poor countries (HIPC)High incomeHondurasHong Kong SAR, ChinaHungaryIBRD onlyIcelandIDA & IBRD totalIDA onlyIDA totalIndiaIndonesiaIran, Islamic Rep.IraqIrelandIsraelItalyJamaicaJapanJordanKazakhstanKenyaKiribatiKorea, Rep.KosovoKuwaitKyrgyz RepublicLao PDRLate-demographic dividendLatin America & Caribbean Latin America & Caribbean (excluding high income)Latin America & the Caribbean (IDA & IBRD countries)LatviaLeast developed countries: UN classificationLebanonLesothoLiberiaLibyaLithuaniaLow & middle incomeLow incomeLower middle incomeLuxembourgMacao SAR, ChinaMacedonia, FYRMadagascarMalawiMalaysiaMaldivesMaliMaltaMarshall IslandsMauritaniaMauritiusMexicoMicronesia, Fed. Sts.Middle East & North AfricaMiddle East & North Africa (excluding high income)Middle East & North Africa (IDA & IBRD countries)Middle incomeMoldovaMongoliaMontenegroMoroccoMozambiqueMyanmarNamibiaNepalNetherlandsNew CaledoniaNew ZealandNicaraguaNigerNigeriaNorth AmericaNorwayOECD membersOmanOther small statesPacific island small statesPakistanPalauPanamaPapua New GuineaParaguayPeruPhilippinesPolandPortugalPost-demographic dividendPre-demographic dividendQatarRomaniaRussian FederationRwandaSamoaSao Tome and PrincipeSaudi ArabiaSenegalSerbiaSeychellesSierra LeoneSingaporeSint Maarten (Dutch part)Slovak RepublicSloveniaSmall statesSolomon IslandsSouth AfricaSouth AsiaSouth Asia (IDA & IBRD)South SudanSpainSri LankaSt. Kitts and NevisSt. LuciaSt. Vincent and the GrenadinesSub-Saharan Africa Sub-Saharan Africa (excluding high income)Sub-Saharan Africa (IDA & IBRD countries)SudanSurinameSwazilandSwedenSwitzerlandSyrian Arab RepublicTajikistanTanzaniaThailandTimor-LesteTogoTongaTrinidad and TobagoTunisiaTurkeyTuvaluUgandaUkraineUnited KingdomUnited StatesUpper middle incomeUruguayVanuatuVenezuela, RBWest Bank and GazaWorldYemen, Rep.ZambiaZimbabwe Linha do tempo:
Nesta escala de tempo está apresentado um gráfico de 1983 ano até 2016 ano World. Dados de 1982 ano ausente. O número de observações reais por data: 34.
Fonte (nome):
Indicadores de desenvolvimento mundial
Fonte (organização):
International Monetary Fund, Balance of Payments Statistics Yearbook and data files.
Categorias:
Private Sector, Trade
Foi atualizado:
23 abr 2017 ano
Indicadores de alterações dos valores ao longo dos anos
Mínimo:
27.484
1 jan 1989 ano
Máximo:
43.933
1 jan 2016 ano
Na data de observação
Valor
Mudança absoluta
A alteração em relação ao valor anterior
1 jan 1983 ano
31.843
+31.843
0.0%
1 jan 1984 ano
30.629
-1.214
-3.81%
1 jan 1985 ano
30.652
+0.024
0.08%
1 jan 1986 ano
30.904
+0.252
0.82%
1 jan 1987 ano
30.648
-0.256
-0.83%
1 jan 1988 ano
30.217
-0.431
-1.41%
1 jan 1989 ano
27.484
-2.733
-9.04%
1 jan 1990 ano
29.451
+1.967
7.16%
1 jan 1991 ano
30.619
+1.168
3.97%
1 jan 1992 ano
32.188
+1.569
5.12%
1 jan 1993 ano
32.732
+0.543
1.69%
1 jan 1994 ano
33.685
+0.954
2.91%
1 jan 1995 ano
33.074
-0.612
-1.82%
1 jan 1996 ano
31.771
-1.303
-3.94%
1 jan 1997 ano
34.759
+2.988
9.41%
1 jan 1998 ano
41.112
+6.353
18.28%
1 jan 1999 ano
40.541
-0.571
-1.39%
1 jan 2000 ano
40.805
+0.264
0.65%
1 jan 2001 ano
41.198
+0.393
0.96%
1 jan 2002 ano
41.945
+0.747
1.81%
1 jan 2003 ano
42.536
+0.591
1.41%
1 jan 2004 ano
41.253
-1.282
-3.01%
1 jan 2005 ano
40.845
-0.408
-0.99%
1 jan 2006 ano
39.862
-0.983
-2.41%
1 jan 2007 ano
40.229
+0.367
0.92%
1 jan 2008 ano
40.485
+0.256
0.64%
1 jan 2009 ano
39.971
-0.514
-1.27%
1 jan 2010 ano
41.967
+1.997
4.99%
1 jan 2011 ano
39.6
-2.367
-5.64%
1 jan 2012 ano
43.009
+3.409
8.61%
1 jan 2013 ano
43.352
+0.343
0.8%
1 jan 2014 ano
43.624
+0.271
0.63%
1 jan 2015 ano
43.123
-0.5
-1.15%
1 jan 2016 ano
43.933
+0.809
1.88%
Classificação de países por estatísticas atuais por anos


Comentários: