29
/pt/
pt
AIzaSyAYiBZKx7MnpbEhh9jyipgxe19OcubqV5w
April 1, 2024
279595
Vanuatu
VUT
true
2
1
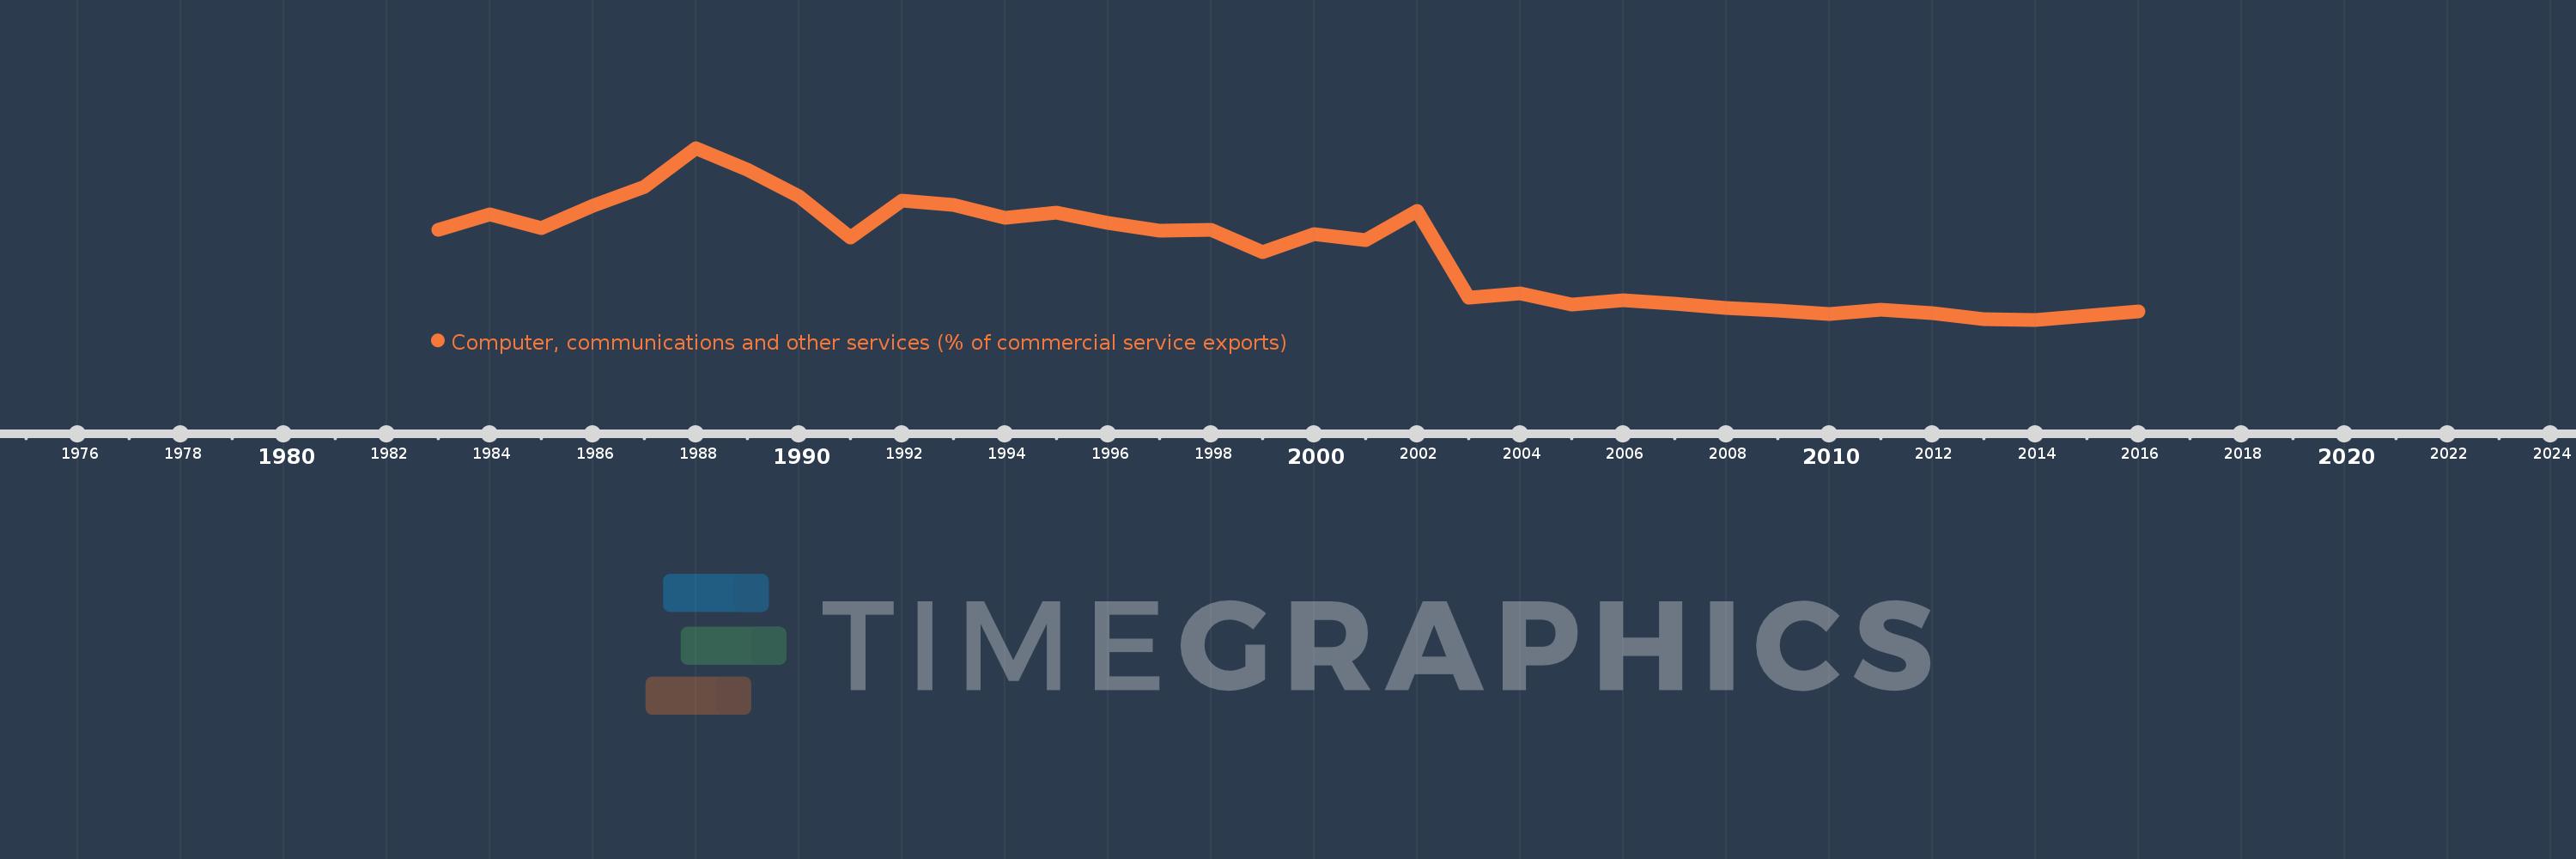
Computer, communications and other services (% of commercial service exports)
2016,2015,2014,2013,2012,2011,2010,2009,2008,2007,2006,2005,2004,2003,2002,2001,2000,1999,1998,1997,1996,1995,1994,1993,1992,1991,1990,1989,1988,1987,1986,1985,1984,1983
Estas estatísticas em outros países:
AfghanistanAlbaniaAlgeriaAngolaAntigua and BarbudaArab WorldArgentinaArmeniaArubaAustraliaAustriaAzerbaijanBahamas, TheBahrainBangladeshBarbadosBelarusBelgiumBelizeBeninBermudaBhutanBoliviaBosnia and HerzegovinaBotswanaBrazilBrunei DarussalamBulgariaBurkina FasoBurundiCabo VerdeCambodiaCameroonCanadaCaribbean small statesCentral African RepublicCentral Europe and the BalticsChadChileChinaColombiaComorosCongo, Dem. Rep.Congo, Rep.Costa RicaCote d'IvoireCroatiaCuracaoCyprusCzech RepublicDenmarkDjiboutiDominicaDominican RepublicEarly-demographic dividendEast Asia & PacificEast Asia & Pacific (excluding high income)East Asia & Pacific (IDA & IBRD countries)EcuadorEgypt, Arab Rep.El SalvadorEritreaEstoniaEthiopiaEuro areaEurope & Central AsiaEurope & Central Asia (excluding high income)Europe & Central Asia (IDA & IBRD countries)European UnionFaroe IslandsFijiFinlandFragile and conflict affected situationsFranceFrench PolynesiaGabonGambia, TheGeorgiaGermanyGhanaGreeceGrenadaGuatemalaGuineaGuinea-BissauGuyanaHaitiHeavily indebted poor countries (HIPC)High incomeHondurasHong Kong SAR, ChinaHungaryIBRD onlyIcelandIDA & IBRD totalIDA onlyIDA totalIndiaIndonesiaIran, Islamic Rep.IraqIrelandIsraelItalyJamaicaJapanJordanKazakhstanKenyaKiribatiKorea, Rep.KosovoKuwaitKyrgyz RepublicLao PDRLate-demographic dividendLatin America & Caribbean Latin America & Caribbean (excluding high income)Latin America & the Caribbean (IDA & IBRD countries)LatviaLeast developed countries: UN classificationLebanonLesothoLiberiaLibyaLithuaniaLow & middle incomeLow incomeLower middle incomeLuxembourgMacao SAR, ChinaMacedonia, FYRMadagascarMalawiMalaysiaMaldivesMaliMaltaMarshall IslandsMauritaniaMauritiusMexicoMicronesia, Fed. Sts.Middle East & North AfricaMiddle East & North Africa (excluding high income)Middle East & North Africa (IDA & IBRD countries)Middle incomeMoldovaMongoliaMontenegroMoroccoMozambiqueMyanmarNamibiaNepalNetherlandsNew CaledoniaNew ZealandNicaraguaNigerNigeriaNorth AmericaNorwayOECD membersOmanOther small statesPacific island small statesPakistanPalauPanamaPapua New GuineaParaguayPeruPhilippinesPolandPortugalPost-demographic dividendPre-demographic dividendQatarRomaniaRussian FederationRwandaSamoaSao Tome and PrincipeSaudi ArabiaSenegalSerbiaSeychellesSierra LeoneSingaporeSint Maarten (Dutch part)Slovak RepublicSloveniaSmall statesSolomon IslandsSouth AfricaSouth AsiaSouth Asia (IDA & IBRD)South SudanSpainSri LankaSt. Kitts and NevisSt. LuciaSt. Vincent and the GrenadinesSub-Saharan Africa Sub-Saharan Africa (excluding high income)Sub-Saharan Africa (IDA & IBRD countries)SudanSurinameSwazilandSwedenSwitzerlandSyrian Arab RepublicTajikistanTanzaniaThailandTimor-LesteTogoTongaTrinidad and TobagoTunisiaTurkeyTuvaluUgandaUkraineUnited KingdomUnited StatesUpper middle incomeUruguayVanuatuVenezuela, RBWest Bank and GazaWorldYemen, Rep.ZambiaZimbabwe Linha do tempo:
Nesta escala de tempo está apresentado um gráfico de 1983 ano até 2016 ano Vanuatu. Dados de 1982 ano ausente. O número de observações reais por data: 34.
Fonte (nome):
Indicadores de desenvolvimento mundial
Fonte (organização):
International Monetary Fund, Balance of Payments Statistics Yearbook and data files.
Categorias:
Private Sector, Trade
Foi atualizado:
23 abr 2017 ano
Indicadores de alterações dos valores ao longo dos anos
Mínimo:
2.078
1 jan 2014 ano
Máximo:
42.682
1 jan 1988 ano
Na data de observação
Valor
Mudança absoluta
A alteração em relação ao valor anterior
1 jan 1983 ano
23.383
+23.383
0.0%
1 jan 1984 ano
26.905
+3.522
15.06%
1 jan 1985 ano
23.778
-3.127
-11.62%
1 jan 1986 ano
28.925
+5.147
21.65%
1 jan 1987 ano
33.457
+4.532
15.67%
1 jan 1988 ano
42.682
+9.225
27.57%
1 jan 1989 ano
37.453
-5.229
-12.25%
1 jan 1990 ano
31.242
-6.212
-16.59%
1 jan 1991 ano
21.438
-9.804
-31.38%
1 jan 1992 ano
30.157
+8.719
40.67%
1 jan 1993 ano
29.26
-0.897
-2.97%
1 jan 1994 ano
26.193
-3.067
-10.48%
1 jan 1995 ano
27.313
+1.12
4.28%
1 jan 1996 ano
24.865
-2.447
-8.96%
1 jan 1997 ano
23.051
-1.814
-7.3%
1 jan 1998 ano
23.287
+0.236
1.02%
1 jan 1999 ano
17.966
-5.32
-22.85%
1 jan 2000 ano
22.399
+4.433
24.67%
1 jan 2001 ano
20.847
-1.552
-6.93%
1 jan 2002 ano
27.751
+6.904
33.12%
1 jan 2003 ano
7.258
-20.492
-73.85%
1 jan 2004 ano
8.284
+1.026
14.13%
1 jan 2005 ano
5.584
-2.7
-32.59%
1 jan 2006 ano
6.663
+1.079
19.32%
1 jan 2007 ano
5.945
-0.718
-10.78%
1 jan 2008 ano
4.862
-1.083
-18.22%
1 jan 2009 ano
4.275
-0.586
-12.06%
1 jan 2010 ano
3.366
-0.909
-21.26%
1 jan 2011 ano
4.421
+1.055
31.33%
1 jan 2012 ano
3.595
-0.827
-18.7%
1 jan 2013 ano
2.308
-1.287
-35.8%
1 jan 2014 ano
2.078
-0.23
-9.97%
1 jan 2015 ano
3.082
+1.005
48.35%
1 jan 2016 ano
3.969
+0.887
28.78%
Classificação de países por estatísticas atuais por anos


Comentários: