29
/pt/
pt
AIzaSyAYiBZKx7MnpbEhh9jyipgxe19OcubqV5w
April 1, 2024
104683
Chile
CHL
true
2
1
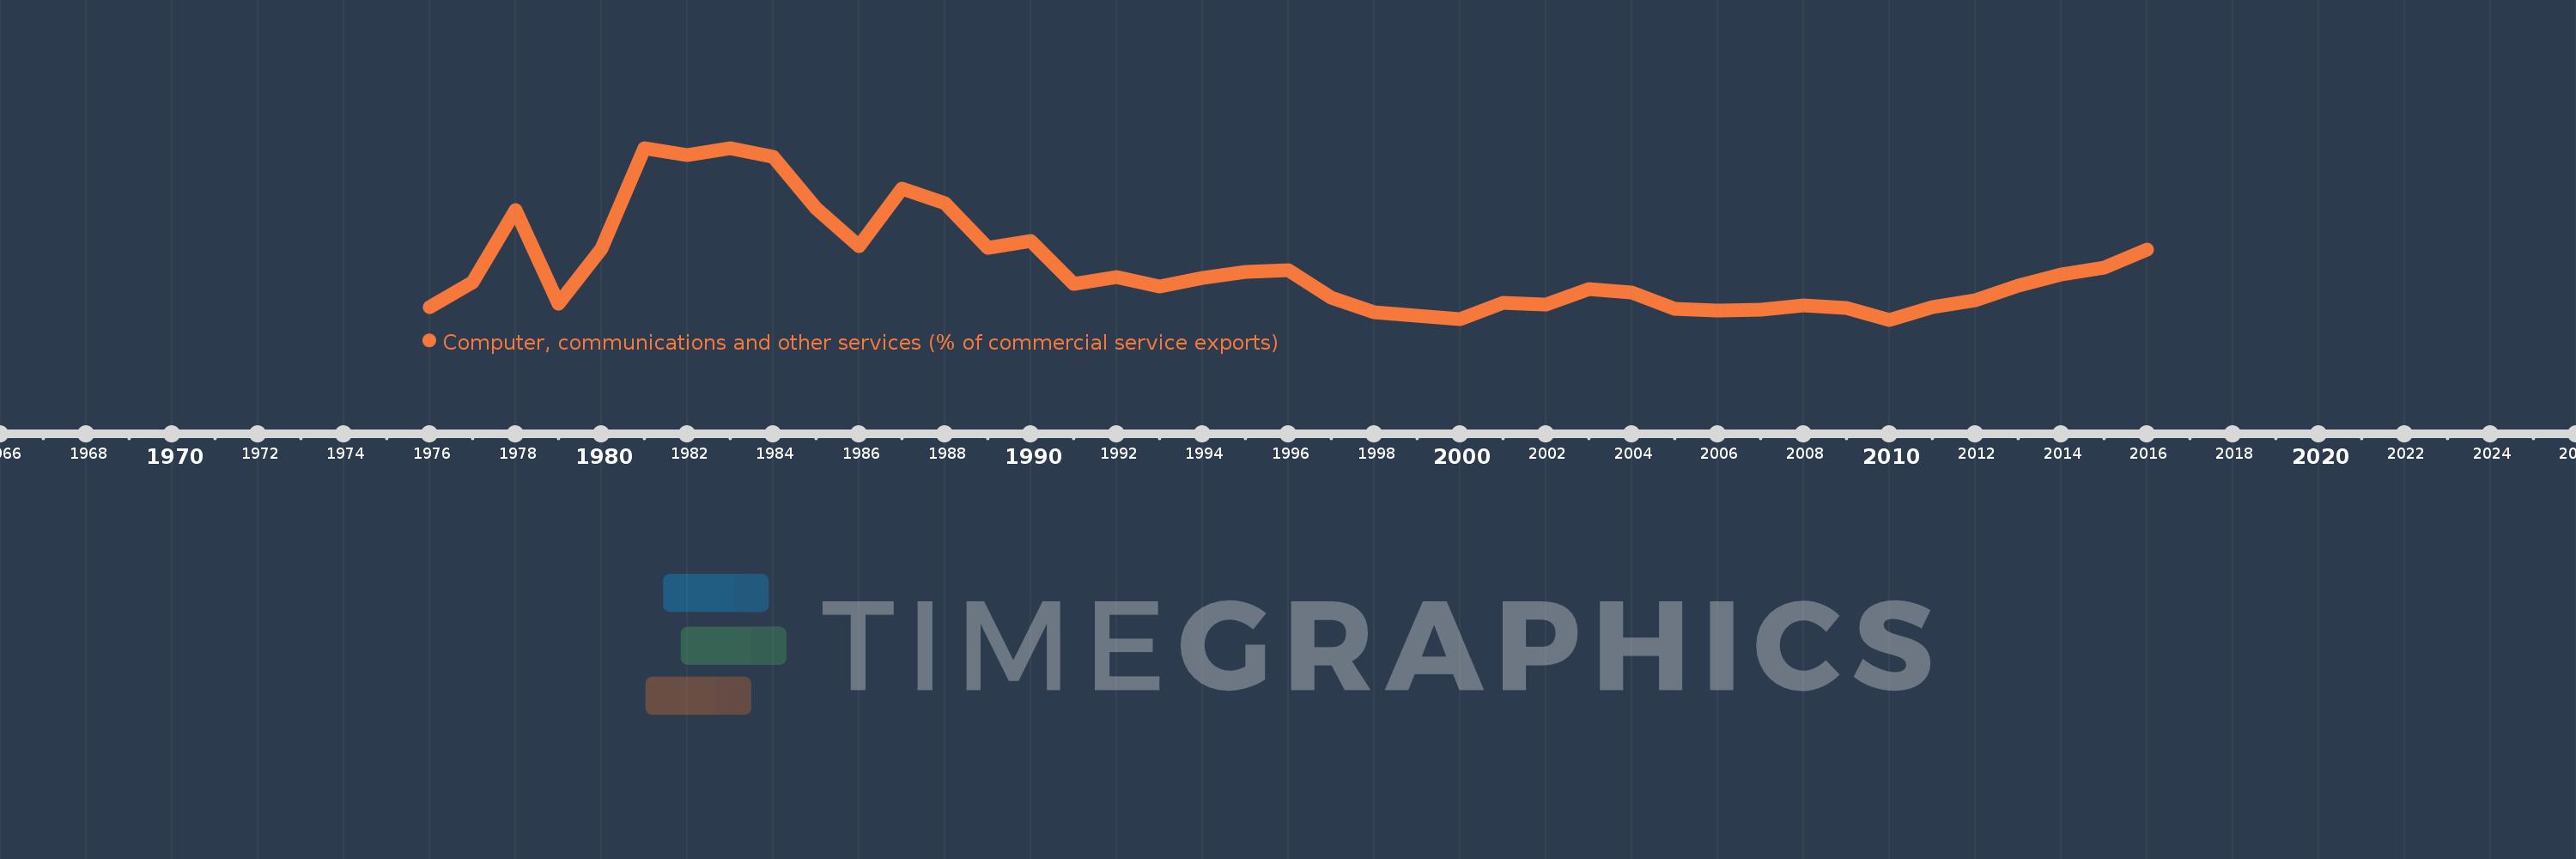
Computer, communications and other services (% of commercial service exports)
2016,2015,2014,2013,2012,2011,2010,2009,2008,2007,2006,2005,2004,2003,2002,2001,2000,1999,1998,1997,1996,1995,1994,1993,1992,1991,1990,1989,1988,1987,1986,1985,1984,1983,1982,1981,1980,1979,1978,1977,1976
Estas estatísticas em outros países:
AfghanistanAlbaniaAlgeriaAngolaAntigua and BarbudaArab WorldArgentinaArmeniaArubaAustraliaAustriaAzerbaijanBahamas, TheBahrainBangladeshBarbadosBelarusBelgiumBelizeBeninBermudaBhutanBoliviaBosnia and HerzegovinaBotswanaBrazilBrunei DarussalamBulgariaBurkina FasoBurundiCabo VerdeCambodiaCameroonCanadaCaribbean small statesCentral African RepublicCentral Europe and the BalticsChadChileChinaColombiaComorosCongo, Dem. Rep.Congo, Rep.Costa RicaCote d'IvoireCroatiaCuracaoCyprusCzech RepublicDenmarkDjiboutiDominicaDominican RepublicEarly-demographic dividendEast Asia & PacificEast Asia & Pacific (excluding high income)East Asia & Pacific (IDA & IBRD countries)EcuadorEgypt, Arab Rep.El SalvadorEritreaEstoniaEthiopiaEuro areaEurope & Central AsiaEurope & Central Asia (excluding high income)Europe & Central Asia (IDA & IBRD countries)European UnionFaroe IslandsFijiFinlandFragile and conflict affected situationsFranceFrench PolynesiaGabonGambia, TheGeorgiaGermanyGhanaGreeceGrenadaGuatemalaGuineaGuinea-BissauGuyanaHaitiHeavily indebted poor countries (HIPC)High incomeHondurasHong Kong SAR, ChinaHungaryIBRD onlyIcelandIDA & IBRD totalIDA onlyIDA totalIndiaIndonesiaIran, Islamic Rep.IraqIrelandIsraelItalyJamaicaJapanJordanKazakhstanKenyaKiribatiKorea, Rep.KosovoKuwaitKyrgyz RepublicLao PDRLate-demographic dividendLatin America & Caribbean Latin America & Caribbean (excluding high income)Latin America & the Caribbean (IDA & IBRD countries)LatviaLeast developed countries: UN classificationLebanonLesothoLiberiaLibyaLithuaniaLow & middle incomeLow incomeLower middle incomeLuxembourgMacao SAR, ChinaMacedonia, FYRMadagascarMalawiMalaysiaMaldivesMaliMaltaMarshall IslandsMauritaniaMauritiusMexicoMicronesia, Fed. Sts.Middle East & North AfricaMiddle East & North Africa (excluding high income)Middle East & North Africa (IDA & IBRD countries)Middle incomeMoldovaMongoliaMontenegroMoroccoMozambiqueMyanmarNamibiaNepalNetherlandsNew CaledoniaNew ZealandNicaraguaNigerNigeriaNorth AmericaNorwayOECD membersOmanOther small statesPacific island small statesPakistanPalauPanamaPapua New GuineaParaguayPeruPhilippinesPolandPortugalPost-demographic dividendPre-demographic dividendQatarRomaniaRussian FederationRwandaSamoaSao Tome and PrincipeSaudi ArabiaSenegalSerbiaSeychellesSierra LeoneSingaporeSint Maarten (Dutch part)Slovak RepublicSloveniaSmall statesSolomon IslandsSouth AfricaSouth AsiaSouth Asia (IDA & IBRD)South SudanSpainSri LankaSt. Kitts and NevisSt. LuciaSt. Vincent and the GrenadinesSub-Saharan Africa Sub-Saharan Africa (excluding high income)Sub-Saharan Africa (IDA & IBRD countries)SudanSurinameSwazilandSwedenSwitzerlandSyrian Arab RepublicTajikistanTanzaniaThailandTimor-LesteTogoTongaTrinidad and TobagoTunisiaTurkeyTuvaluUgandaUkraineUnited KingdomUnited StatesUpper middle incomeUruguayVanuatuVenezuela, RBWest Bank and GazaWorldYemen, Rep.ZambiaZimbabwe Linha do tempo:
Nesta escala de tempo está apresentado um gráfico de 1976 ano até 2016 ano Chile. Dados de 1975 ano ausente. O número de observações reais por data: 41.
Fonte (nome):
Indicadores de desenvolvimento mundial
Fonte (organização):
International Monetary Fund, Balance of Payments Statistics Yearbook and data files.
Categorias:
Private Sector, Trade
Foi atualizado:
23 abr 2017 ano
Indicadores de alterações dos valores ao longo dos anos
Mínimo:
18.739
1 jan 2010 ano
Máximo:
50.082
1 jan 1981 ano
Na data de observação
Valor
Mudança absoluta
A alteração em relação ao valor anterior
1 jan 1976 ano
21.097
+21.097
0.0%
1 jan 1977 ano
25.54
+4.443
21.06%
1 jan 1978 ano
38.786
+13.247
51.87%
1 jan 1979 ano
21.739
-17.047
-43.95%
1 jan 1980 ano
31.687
+9.948
45.76%
1 jan 1981 ano
50.082
+18.395
58.05%
1 jan 1982 ano
48.748
-1.334
-2.66%
1 jan 1983 ano
50.0
+1.252
2.57%
1 jan 1984 ano
48.413
-1.587
-3.17%
1 jan 1985 ano
39.032
-9.38
-19.38%
1 jan 1986 ano
32.099
-6.933
-17.76%
1 jan 1987 ano
42.726
+10.627
33.11%
1 jan 1988 ano
40.082
-2.644
-6.19%
1 jan 1989 ano
31.933
-8.149
-20.33%
1 jan 1990 ano
33.154
+1.221
3.82%
1 jan 1991 ano
25.335
-7.819
-23.59%
1 jan 1992 ano
26.527
+1.192
4.7%
1 jan 1993 ano
24.882
-1.645
-6.2%
1 jan 1994 ano
26.381
+1.499
6.03%
1 jan 1995 ano
27.4
+1.018
3.86%
1 jan 1996 ano
27.822
+0.422
1.54%
1 jan 1997 ano
22.769
-5.053
-18.16%
1 jan 1998 ano
20.038
-2.731
-12.0%
1 jan 1999 ano
19.434
-0.603
-3.01%
1 jan 2000 ano
18.83
-0.605
-3.11%
1 jan 2001 ano
21.887
+3.057
16.24%
1 jan 2002 ano
21.465
-0.422
-1.93%
1 jan 2003 ano
24.354
+2.889
13.46%
1 jan 2004 ano
23.713
-0.641
-2.63%
1 jan 2005 ano
20.679
-3.034
-12.79%
1 jan 2006 ano
20.358
-0.321
-1.55%
1 jan 2007 ano
20.614
+0.256
1.26%
1 jan 2008 ano
21.428
+0.814
3.95%
1 jan 2009 ano
20.848
-0.58
-2.71%
1 jan 2010 ano
18.739
-2.109
-10.11%
1 jan 2011 ano
21.022
+2.283
12.18%
1 jan 2012 ano
22.281
+1.259
5.99%
1 jan 2013 ano
24.946
+2.665
11.96%
1 jan 2014 ano
26.989
+2.043
8.19%
1 jan 2015 ano
28.323
+1.334
4.94%
1 jan 2016 ano
31.566
+3.243
11.45%
Classificação de países por estatísticas atuais por anos


Comentários: