29
/pt/
pt
AIzaSyAYiBZKx7MnpbEhh9jyipgxe19OcubqV5w
April 1, 2024
194007
Mauritius
MUS
true
2
1
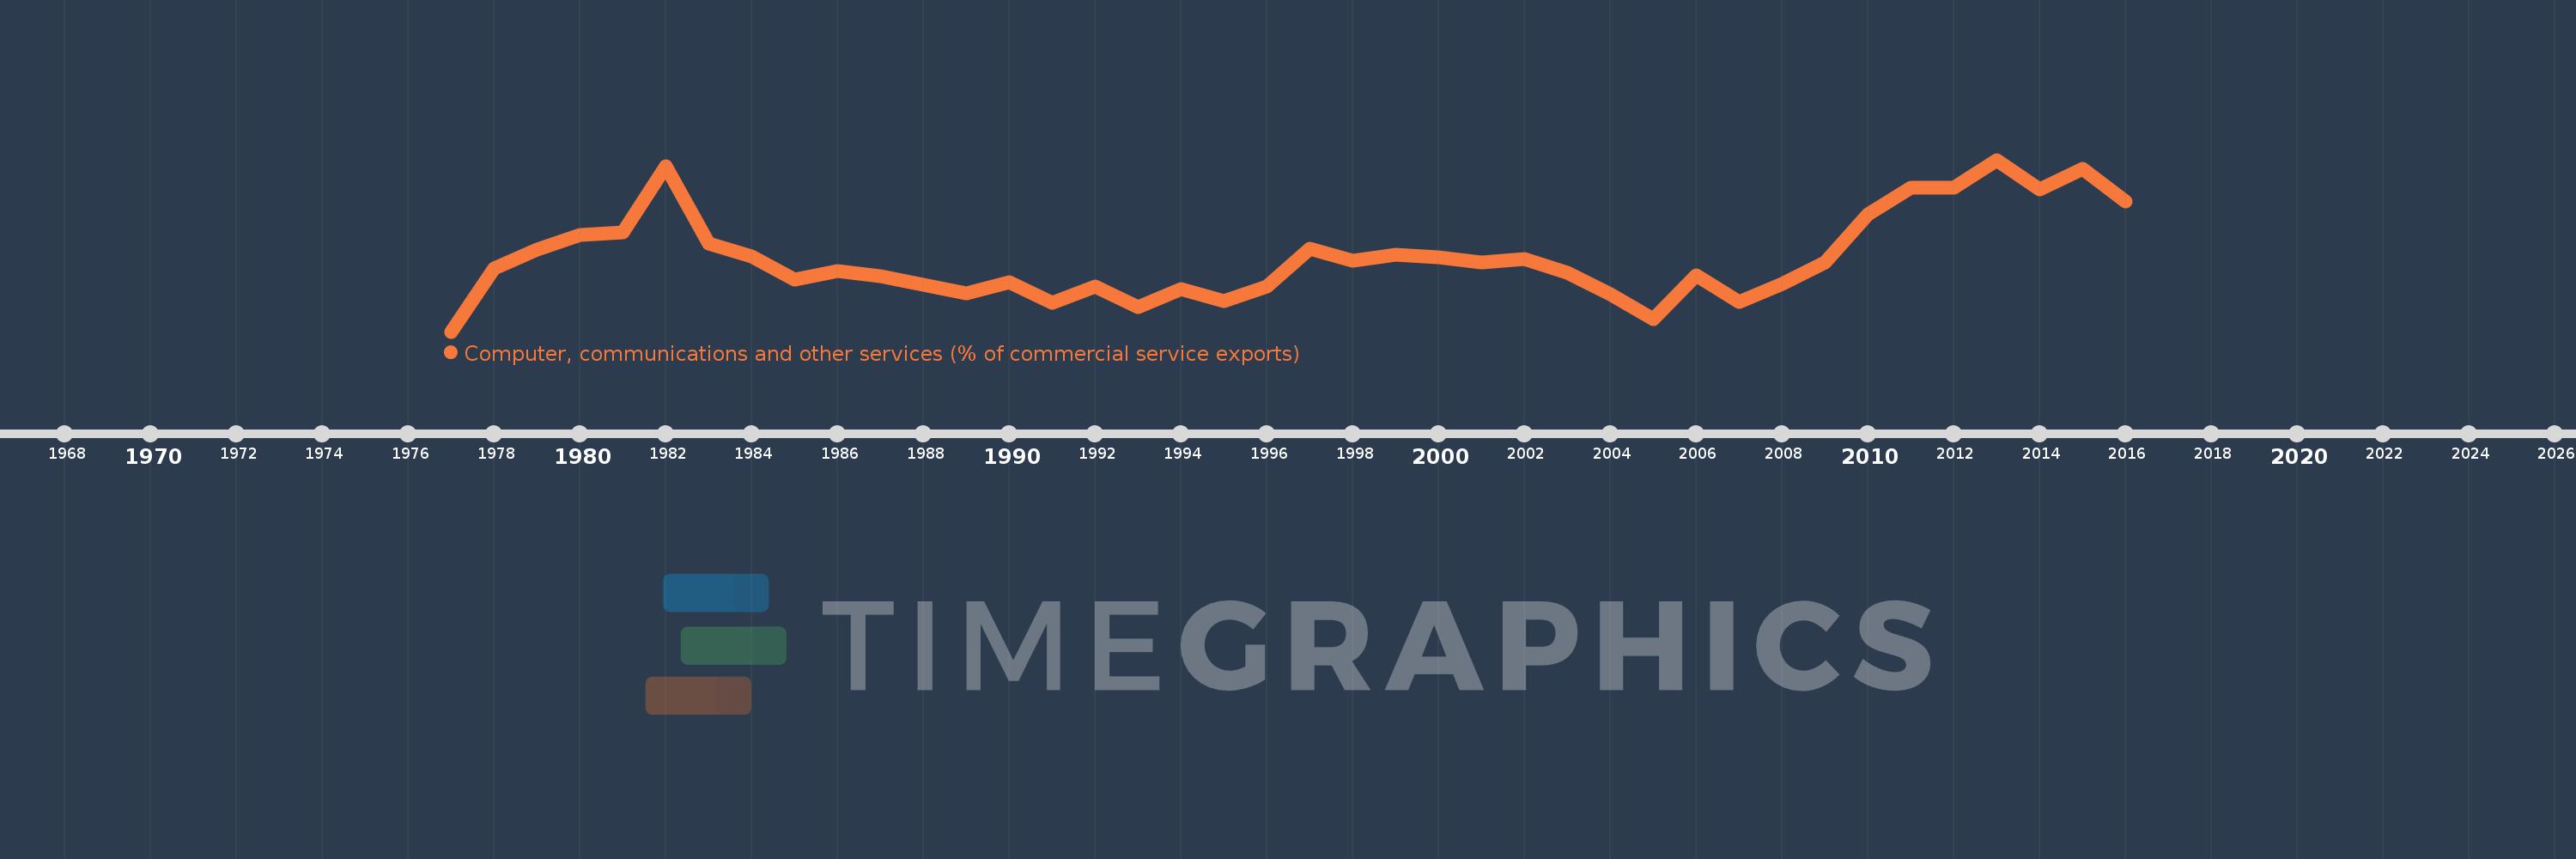
Computer, communications and other services (% of commercial service exports)
2016,2015,2014,2013,2012,2011,2010,2009,2008,2007,2006,2005,2004,2003,2002,2001,2000,1999,1998,1997,1996,1995,1994,1993,1992,1991,1990,1989,1988,1987,1986,1985,1984,1983,1982,1981,1980,1979,1978,1977
Estas estatísticas em outros países:
AfghanistanAlbaniaAlgeriaAngolaAntigua and BarbudaArab WorldArgentinaArmeniaArubaAustraliaAustriaAzerbaijanBahamas, TheBahrainBangladeshBarbadosBelarusBelgiumBelizeBeninBermudaBhutanBoliviaBosnia and HerzegovinaBotswanaBrazilBrunei DarussalamBulgariaBurkina FasoBurundiCabo VerdeCambodiaCameroonCanadaCaribbean small statesCentral African RepublicCentral Europe and the BalticsChadChileChinaColombiaComorosCongo, Dem. Rep.Congo, Rep.Costa RicaCote d'IvoireCroatiaCuracaoCyprusCzech RepublicDenmarkDjiboutiDominicaDominican RepublicEarly-demographic dividendEast Asia & PacificEast Asia & Pacific (excluding high income)East Asia & Pacific (IDA & IBRD countries)EcuadorEgypt, Arab Rep.El SalvadorEritreaEstoniaEthiopiaEuro areaEurope & Central AsiaEurope & Central Asia (excluding high income)Europe & Central Asia (IDA & IBRD countries)European UnionFaroe IslandsFijiFinlandFragile and conflict affected situationsFranceFrench PolynesiaGabonGambia, TheGeorgiaGermanyGhanaGreeceGrenadaGuatemalaGuineaGuinea-BissauGuyanaHaitiHeavily indebted poor countries (HIPC)High incomeHondurasHong Kong SAR, ChinaHungaryIBRD onlyIcelandIDA & IBRD totalIDA onlyIDA totalIndiaIndonesiaIran, Islamic Rep.IraqIrelandIsraelItalyJamaicaJapanJordanKazakhstanKenyaKiribatiKorea, Rep.KosovoKuwaitKyrgyz RepublicLao PDRLate-demographic dividendLatin America & Caribbean Latin America & Caribbean (excluding high income)Latin America & the Caribbean (IDA & IBRD countries)LatviaLeast developed countries: UN classificationLebanonLesothoLiberiaLibyaLithuaniaLow & middle incomeLow incomeLower middle incomeLuxembourgMacao SAR, ChinaMacedonia, FYRMadagascarMalawiMalaysiaMaldivesMaliMaltaMarshall IslandsMauritaniaMauritiusMexicoMicronesia, Fed. Sts.Middle East & North AfricaMiddle East & North Africa (excluding high income)Middle East & North Africa (IDA & IBRD countries)Middle incomeMoldovaMongoliaMontenegroMoroccoMozambiqueMyanmarNamibiaNepalNetherlandsNew CaledoniaNew ZealandNicaraguaNigerNigeriaNorth AmericaNorwayOECD membersOmanOther small statesPacific island small statesPakistanPalauPanamaPapua New GuineaParaguayPeruPhilippinesPolandPortugalPost-demographic dividendPre-demographic dividendQatarRomaniaRussian FederationRwandaSamoaSao Tome and PrincipeSaudi ArabiaSenegalSerbiaSeychellesSierra LeoneSingaporeSint Maarten (Dutch part)Slovak RepublicSloveniaSmall statesSolomon IslandsSouth AfricaSouth AsiaSouth Asia (IDA & IBRD)South SudanSpainSri LankaSt. Kitts and NevisSt. LuciaSt. Vincent and the GrenadinesSub-Saharan Africa Sub-Saharan Africa (excluding high income)Sub-Saharan Africa (IDA & IBRD countries)SudanSurinameSwazilandSwedenSwitzerlandSyrian Arab RepublicTajikistanTanzaniaThailandTimor-LesteTogoTongaTrinidad and TobagoTunisiaTurkeyTuvaluUgandaUkraineUnited KingdomUnited StatesUpper middle incomeUruguayVanuatuVenezuela, RBWest Bank and GazaWorldYemen, Rep.ZambiaZimbabwe Linha do tempo:
Nesta escala de tempo está apresentado um gráfico de 1977 ano até 2016 ano Mauritius. Dados de 1976 ano ausente. O número de observações reais por data: 40.
Fonte (nome):
Indicadores de desenvolvimento mundial
Fonte (organização):
International Monetary Fund, Balance of Payments Statistics Yearbook and data files.
Categorias:
Private Sector, Trade
Foi atualizado:
23 abr 2017 ano
Indicadores de alterações dos valores ao longo dos anos
Mínimo:
11.257
1 jan 1977 ano
Máximo:
38.687
1 jan 2013 ano
Na data de observação
Valor
Mudança absoluta
A alteração em relação ao valor anterior
1 jan 1977 ano
11.257
+11.257
0.0%
1 jan 1978 ano
21.306
+10.049
89.28%
1 jan 1979 ano
24.292
+2.986
14.02%
1 jan 1980 ano
26.701
+2.409
9.92%
1 jan 1981 ano
27.094
+0.393
1.47%
1 jan 1982 ano
37.61
+10.517
38.82%
1 jan 1983 ano
25.379
-12.231
-32.52%
1 jan 1984 ano
23.23
-2.149
-8.47%
1 jan 1985 ano
19.548
-3.683
-15.85%
1 jan 1986 ano
20.912
+1.365
6.98%
1 jan 1987 ano
20.098
-0.814
-3.89%
1 jan 1988 ano
18.684
-1.414
-7.04%
1 jan 1989 ano
17.368
-1.316
-7.05%
1 jan 1990 ano
19.119
+1.751
10.08%
1 jan 1991 ano
15.841
-3.278
-17.15%
1 jan 1992 ano
18.454
+2.614
16.5%
1 jan 1993 ano
15.131
-3.323
-18.01%
1 jan 1994 ano
18.11
+2.979
19.69%
1 jan 1995 ano
16.066
-2.044
-11.29%
1 jan 1996 ano
18.52
+2.454
15.27%
1 jan 1997 ano
24.442
+5.921
31.97%
1 jan 1998 ano
22.591
-1.85
-7.57%
1 jan 1999 ano
23.575
+0.984
4.36%
1 jan 2000 ano
23.055
-0.52
-2.21%
1 jan 2001 ano
22.32
-0.736
-3.19%
1 jan 2002 ano
22.832
+0.512
2.29%
1 jan 2003 ano
20.661
-2.171
-9.51%
1 jan 2004 ano
17.211
-3.45
-16.7%
1 jan 2005 ano
13.275
-3.936
-22.87%
1 jan 2006 ano
20.298
+7.023
52.91%
1 jan 2007 ano
15.956
-4.342
-21.39%
1 jan 2008 ano
18.822
+2.866
17.96%
1 jan 2009 ano
22.276
+3.454
18.35%
1 jan 2010 ano
29.939
+7.664
34.4%
1 jan 2011 ano
34.235
+4.296
14.35%
1 jan 2012 ano
34.258
+0.023
0.07%
1 jan 2013 ano
38.687
+4.429
12.93%
1 jan 2014 ano
34.012
-4.675
-12.08%
1 jan 2015 ano
37.235
+3.223
9.48%
1 jan 2016 ano
32.094
-5.141
-13.81%
Classificação de países por estatísticas atuais por anos


Comentários: