29
/pt/
pt
AIzaSyAYiBZKx7MnpbEhh9jyipgxe19OcubqV5w
April 1, 2024
116717
Cyprus
CYP
true
2
1
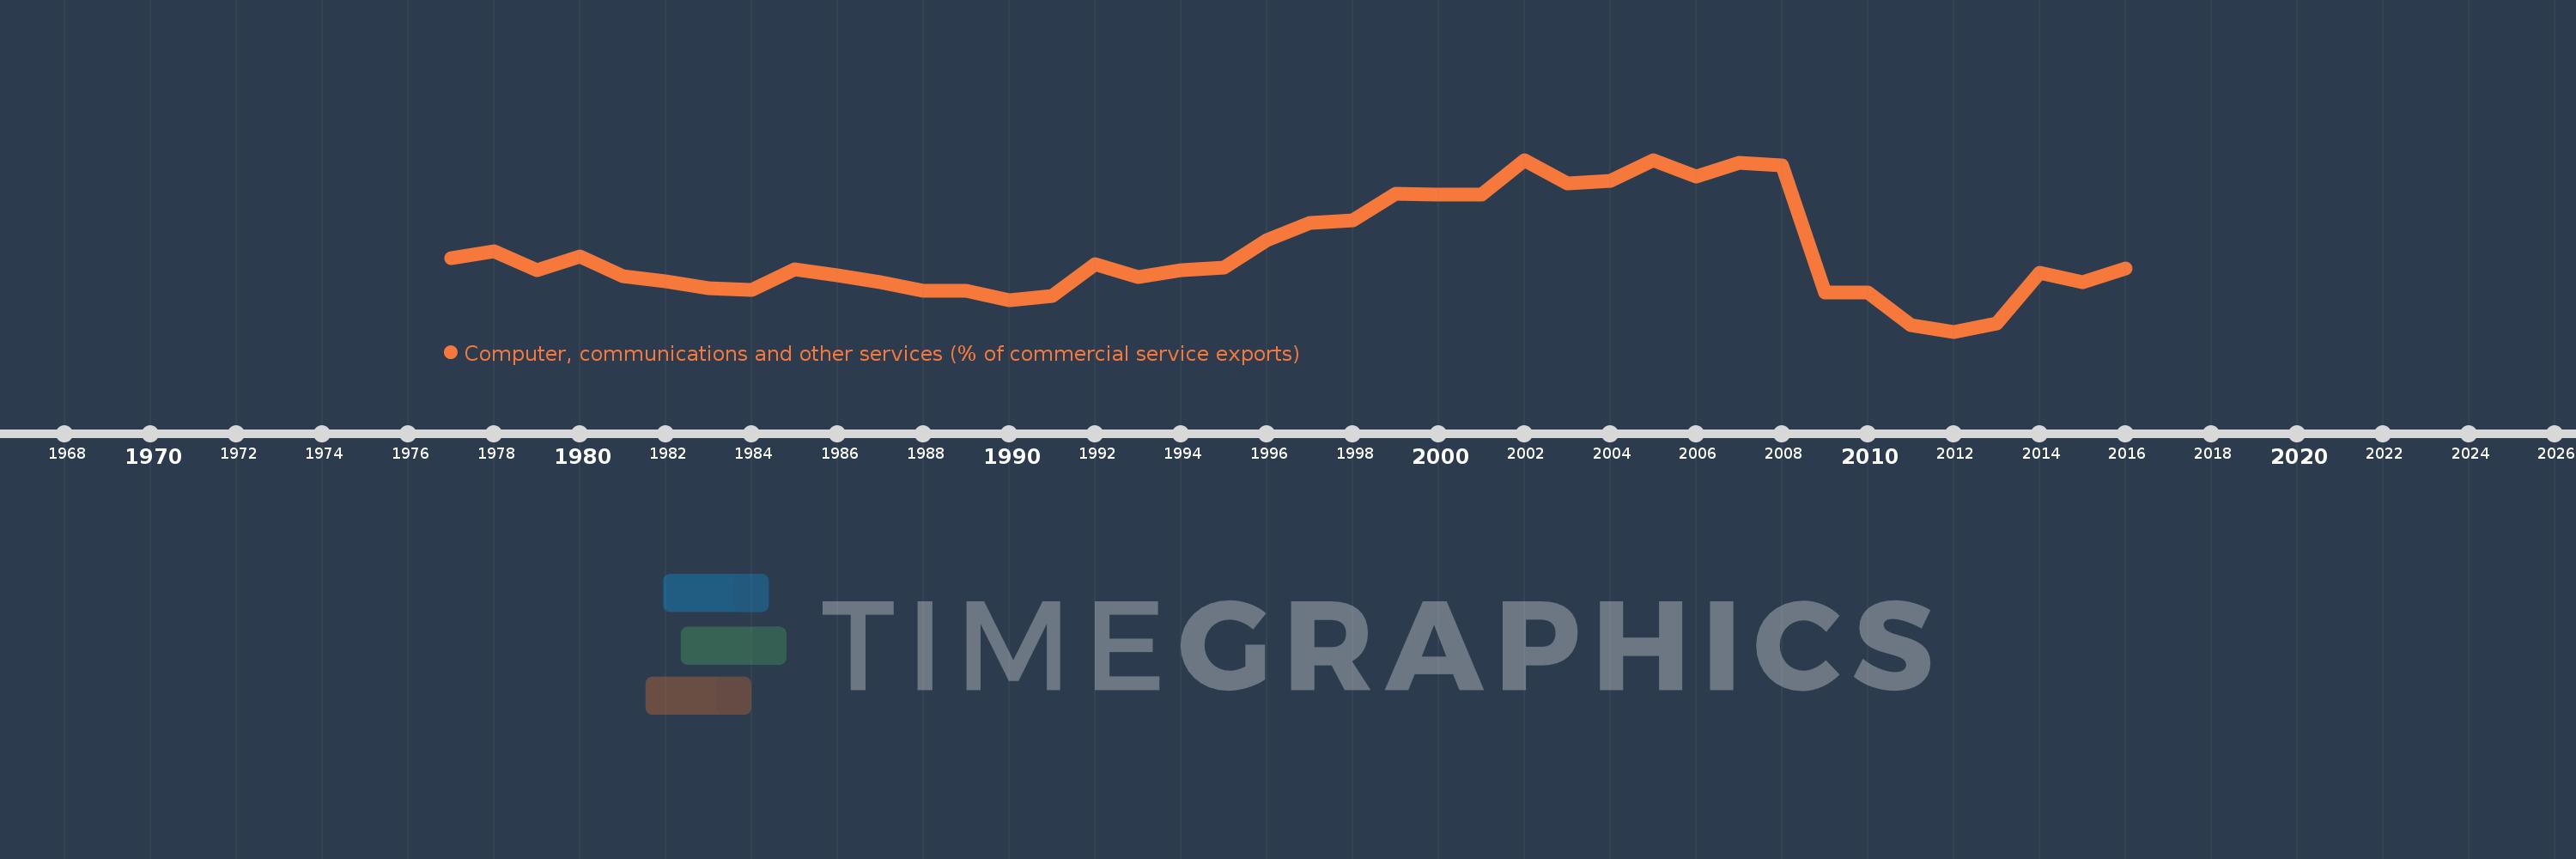
Computer, communications and other services (% of commercial service exports)
2016,2015,2014,2013,2012,2011,2010,2009,2008,2007,2006,2005,2004,2003,2002,2001,2000,1999,1998,1997,1996,1995,1994,1993,1992,1991,1990,1989,1988,1987,1986,1985,1984,1983,1982,1981,1980,1979,1978,1977
Estas estatísticas em outros países:
AfghanistanAlbaniaAlgeriaAngolaAntigua and BarbudaArab WorldArgentinaArmeniaArubaAustraliaAustriaAzerbaijanBahamas, TheBahrainBangladeshBarbadosBelarusBelgiumBelizeBeninBermudaBhutanBoliviaBosnia and HerzegovinaBotswanaBrazilBrunei DarussalamBulgariaBurkina FasoBurundiCabo VerdeCambodiaCameroonCanadaCaribbean small statesCentral African RepublicCentral Europe and the BalticsChadChileChinaColombiaComorosCongo, Dem. Rep.Congo, Rep.Costa RicaCote d'IvoireCroatiaCuracaoCyprusCzech RepublicDenmarkDjiboutiDominicaDominican RepublicEarly-demographic dividendEast Asia & PacificEast Asia & Pacific (excluding high income)East Asia & Pacific (IDA & IBRD countries)EcuadorEgypt, Arab Rep.El SalvadorEritreaEstoniaEthiopiaEuro areaEurope & Central AsiaEurope & Central Asia (excluding high income)Europe & Central Asia (IDA & IBRD countries)European UnionFaroe IslandsFijiFinlandFragile and conflict affected situationsFranceFrench PolynesiaGabonGambia, TheGeorgiaGermanyGhanaGreeceGrenadaGuatemalaGuineaGuinea-BissauGuyanaHaitiHeavily indebted poor countries (HIPC)High incomeHondurasHong Kong SAR, ChinaHungaryIBRD onlyIcelandIDA & IBRD totalIDA onlyIDA totalIndiaIndonesiaIran, Islamic Rep.IraqIrelandIsraelItalyJamaicaJapanJordanKazakhstanKenyaKiribatiKorea, Rep.KosovoKuwaitKyrgyz RepublicLao PDRLate-demographic dividendLatin America & Caribbean Latin America & Caribbean (excluding high income)Latin America & the Caribbean (IDA & IBRD countries)LatviaLeast developed countries: UN classificationLebanonLesothoLiberiaLibyaLithuaniaLow & middle incomeLow incomeLower middle incomeLuxembourgMacao SAR, ChinaMacedonia, FYRMadagascarMalawiMalaysiaMaldivesMaliMaltaMarshall IslandsMauritaniaMauritiusMexicoMicronesia, Fed. Sts.Middle East & North AfricaMiddle East & North Africa (excluding high income)Middle East & North Africa (IDA & IBRD countries)Middle incomeMoldovaMongoliaMontenegroMoroccoMozambiqueMyanmarNamibiaNepalNetherlandsNew CaledoniaNew ZealandNicaraguaNigerNigeriaNorth AmericaNorwayOECD membersOmanOther small statesPacific island small statesPakistanPalauPanamaPapua New GuineaParaguayPeruPhilippinesPolandPortugalPost-demographic dividendPre-demographic dividendQatarRomaniaRussian FederationRwandaSamoaSao Tome and PrincipeSaudi ArabiaSenegalSerbiaSeychellesSierra LeoneSingaporeSint Maarten (Dutch part)Slovak RepublicSloveniaSmall statesSolomon IslandsSouth AfricaSouth AsiaSouth Asia (IDA & IBRD)South SudanSpainSri LankaSt. Kitts and NevisSt. LuciaSt. Vincent and the GrenadinesSub-Saharan Africa Sub-Saharan Africa (excluding high income)Sub-Saharan Africa (IDA & IBRD countries)SudanSurinameSwazilandSwedenSwitzerlandSyrian Arab RepublicTajikistanTanzaniaThailandTimor-LesteTogoTongaTrinidad and TobagoTunisiaTurkeyTuvaluUgandaUkraineUnited KingdomUnited StatesUpper middle incomeUruguayVanuatuVenezuela, RBWest Bank and GazaWorldYemen, Rep.ZambiaZimbabwe Linha do tempo:
Nesta escala de tempo está apresentado um gráfico de 1977 ano até 2016 ano Cyprus. Dados de 1976 ano ausente. O número de observações reais por data: 40.
Fonte (nome):
Indicadores de desenvolvimento mundial
Fonte (organização):
International Monetary Fund, Balance of Payments Statistics Yearbook and data files.
Categorias:
Private Sector, Trade
Foi atualizado:
23 abr 2017 ano
Indicadores de alterações dos valores ao longo dos anos
Mínimo:
10.249
1 jan 2012 ano
Máximo:
27.995
1 jan 2002 ano
Na data de observação
Valor
Mudança absoluta
A alteração em relação ao valor anterior
1 jan 1977 ano
17.874
+17.874
0.0%
1 jan 1978 ano
18.503
+0.629
3.52%
1 jan 1979 ano
16.586
-1.917
-10.36%
1 jan 1980 ano
17.98
+1.394
8.4%
1 jan 1981 ano
15.997
-1.983
-11.03%
1 jan 1982 ano
15.403
-0.593
-3.71%
1 jan 1983 ano
14.7
-0.703
-4.56%
1 jan 1984 ano
14.549
-0.151
-1.03%
1 jan 1985 ano
16.712
+2.163
14.87%
1 jan 1986 ano
16.094
-0.618
-3.7%
1 jan 1987 ano
15.39
-0.704
-4.37%
1 jan 1988 ano
14.451
-0.94
-6.1%
1 jan 1989 ano
14.491
+0.04
0.28%
1 jan 1990 ano
13.523
-0.967
-6.68%
1 jan 1991 ano
13.953
+0.429
3.17%
1 jan 1992 ano
17.198
+3.245
23.26%
1 jan 1993 ano
15.876
-1.322
-7.69%
1 jan 1994 ano
16.595
+0.719
4.53%
1 jan 1995 ano
16.828
+0.233
1.4%
1 jan 1996 ano
19.726
+2.899
17.23%
1 jan 1997 ano
21.447
+1.721
8.72%
1 jan 1998 ano
21.761
+0.314
1.46%
1 jan 1999 ano
24.463
+2.703
12.42%
1 jan 2000 ano
24.38
-0.083
-0.34%
1 jan 2001 ano
24.442
+0.061
0.25%
1 jan 2002 ano
27.995
+3.554
14.54%
1 jan 2003 ano
25.544
-2.451
-8.76%
1 jan 2004 ano
25.857
+0.313
1.22%
1 jan 2005 ano
27.969
+2.112
8.17%
1 jan 2006 ano
26.256
-1.713
-6.12%
1 jan 2007 ano
27.705
+1.449
5.52%
1 jan 2008 ano
27.406
-0.299
-1.08%
1 jan 2009 ano
14.306
-13.1
-47.8%
1 jan 2010 ano
14.275
-0.032
-0.22%
1 jan 2011 ano
10.907
-3.368
-23.59%
1 jan 2012 ano
10.249
-0.658
-6.03%
1 jan 2013 ano
11.064
+0.815
7.95%
1 jan 2014 ano
16.371
+5.307
47.97%
1 jan 2015 ano
15.361
-1.011
-6.17%
1 jan 2016 ano
16.73
+1.37
8.92%
Classificação de países por estatísticas atuais por anos


Comentários: