29
/pt/
pt
AIzaSyAYiBZKx7MnpbEhh9jyipgxe19OcubqV5w
April 1, 2024
219405
Papua New Guinea
PNG
true
2
1
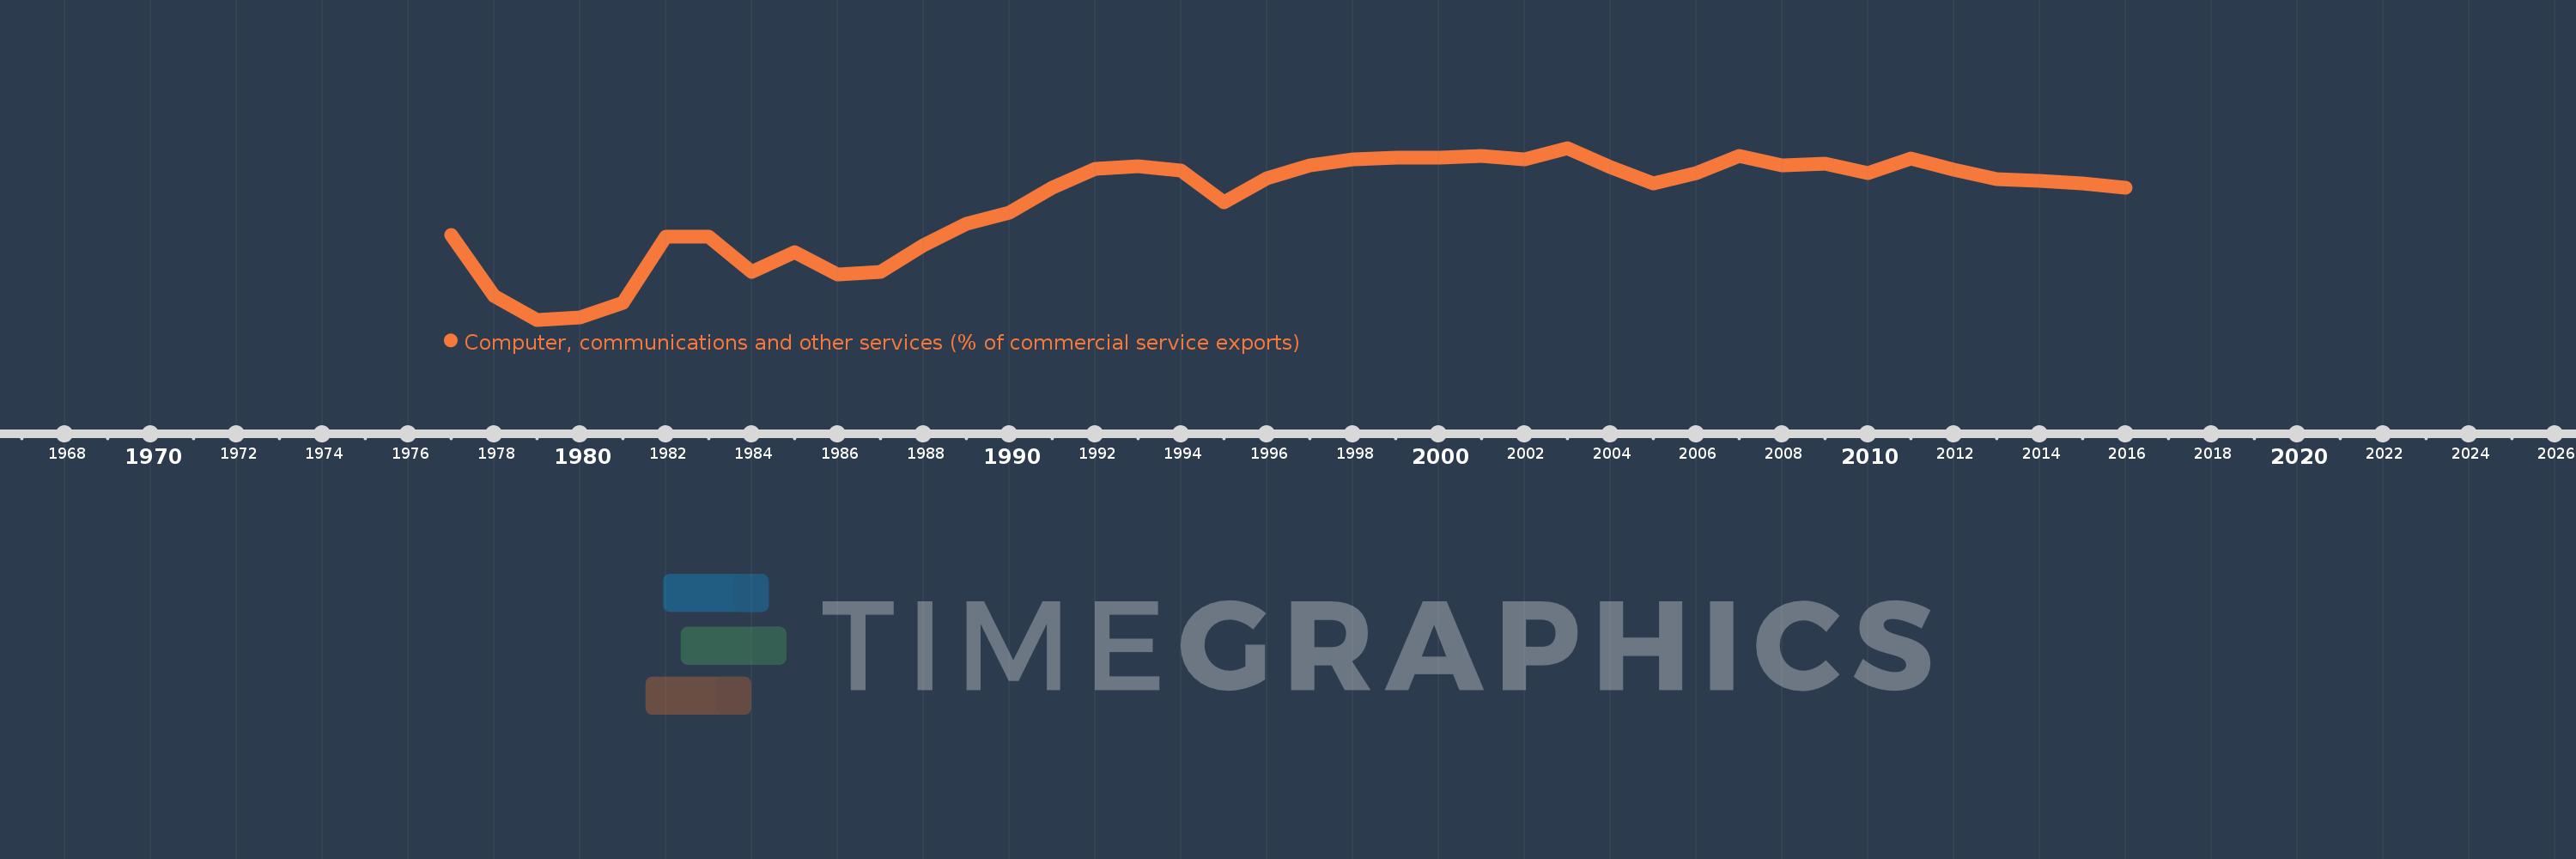
Computer, communications and other services (% of commercial service exports)
2016,2015,2014,2013,2012,2011,2010,2009,2008,2007,2006,2005,2004,2003,2002,2001,2000,1999,1998,1997,1996,1995,1994,1993,1992,1991,1990,1989,1988,1987,1986,1985,1984,1983,1982,1981,1980,1979,1978,1977
Estas estatísticas em outros países:
AfghanistanAlbaniaAlgeriaAngolaAntigua and BarbudaArab WorldArgentinaArmeniaArubaAustraliaAustriaAzerbaijanBahamas, TheBahrainBangladeshBarbadosBelarusBelgiumBelizeBeninBermudaBhutanBoliviaBosnia and HerzegovinaBotswanaBrazilBrunei DarussalamBulgariaBurkina FasoBurundiCabo VerdeCambodiaCameroonCanadaCaribbean small statesCentral African RepublicCentral Europe and the BalticsChadChileChinaColombiaComorosCongo, Dem. Rep.Congo, Rep.Costa RicaCote d'IvoireCroatiaCuracaoCyprusCzech RepublicDenmarkDjiboutiDominicaDominican RepublicEarly-demographic dividendEast Asia & PacificEast Asia & Pacific (excluding high income)East Asia & Pacific (IDA & IBRD countries)EcuadorEgypt, Arab Rep.El SalvadorEritreaEstoniaEthiopiaEuro areaEurope & Central AsiaEurope & Central Asia (excluding high income)Europe & Central Asia (IDA & IBRD countries)European UnionFaroe IslandsFijiFinlandFragile and conflict affected situationsFranceFrench PolynesiaGabonGambia, TheGeorgiaGermanyGhanaGreeceGrenadaGuatemalaGuineaGuinea-BissauGuyanaHaitiHeavily indebted poor countries (HIPC)High incomeHondurasHong Kong SAR, ChinaHungaryIBRD onlyIcelandIDA & IBRD totalIDA onlyIDA totalIndiaIndonesiaIran, Islamic Rep.IraqIrelandIsraelItalyJamaicaJapanJordanKazakhstanKenyaKiribatiKorea, Rep.KosovoKuwaitKyrgyz RepublicLao PDRLate-demographic dividendLatin America & Caribbean Latin America & Caribbean (excluding high income)Latin America & the Caribbean (IDA & IBRD countries)LatviaLeast developed countries: UN classificationLebanonLesothoLiberiaLibyaLithuaniaLow & middle incomeLow incomeLower middle incomeLuxembourgMacao SAR, ChinaMacedonia, FYRMadagascarMalawiMalaysiaMaldivesMaliMaltaMarshall IslandsMauritaniaMauritiusMexicoMicronesia, Fed. Sts.Middle East & North AfricaMiddle East & North Africa (excluding high income)Middle East & North Africa (IDA & IBRD countries)Middle incomeMoldovaMongoliaMontenegroMoroccoMozambiqueMyanmarNamibiaNepalNetherlandsNew CaledoniaNew ZealandNicaraguaNigerNigeriaNorth AmericaNorwayOECD membersOmanOther small statesPacific island small statesPakistanPalauPanamaPapua New GuineaParaguayPeruPhilippinesPolandPortugalPost-demographic dividendPre-demographic dividendQatarRomaniaRussian FederationRwandaSamoaSao Tome and PrincipeSaudi ArabiaSenegalSerbiaSeychellesSierra LeoneSingaporeSint Maarten (Dutch part)Slovak RepublicSloveniaSmall statesSolomon IslandsSouth AfricaSouth AsiaSouth Asia (IDA & IBRD)South SudanSpainSri LankaSt. Kitts and NevisSt. LuciaSt. Vincent and the GrenadinesSub-Saharan Africa Sub-Saharan Africa (excluding high income)Sub-Saharan Africa (IDA & IBRD countries)SudanSurinameSwazilandSwedenSwitzerlandSyrian Arab RepublicTajikistanTanzaniaThailandTimor-LesteTogoTongaTrinidad and TobagoTunisiaTurkeyTuvaluUgandaUkraineUnited KingdomUnited StatesUpper middle incomeUruguayVanuatuVenezuela, RBWest Bank and GazaWorldYemen, Rep.ZambiaZimbabwe Linha do tempo:
Nesta escala de tempo está apresentado um gráfico de 1977 ano até 2016 ano Papua New Guinea. Dados de 1976 ano ausente. O número de observações reais por data: 40.
Fonte (nome):
Indicadores de desenvolvimento mundial
Fonte (organização):
International Monetary Fund, Balance of Payments Statistics Yearbook and data files.
Categorias:
Private Sector, Trade
Foi atualizado:
23 abr 2017 ano
Indicadores de alterações dos valores ao longo dos anos
Mínimo:
17.245
1 jan 1979 ano
Máximo:
93.858
1 jan 2003 ano
Na data de observação
Valor
Mudança absoluta
A alteração em relação ao valor anterior
1 jan 1977 ano
55.146
+55.146
0.0%
1 jan 1978 ano
27.789
-27.357
-49.61%
1 jan 1979 ano
17.245
-10.544
-37.94%
1 jan 1980 ano
18.299
+1.054
6.11%
1 jan 1981 ano
24.681
+6.383
34.88%
1 jan 1982 ano
54.408
+29.726
120.44%
1 jan 1983 ano
54.165
-0.242
-0.45%
1 jan 1984 ano
38.429
-15.736
-29.05%
1 jan 1985 ano
47.387
+8.958
23.31%
1 jan 1986 ano
37.595
-9.792
-20.66%
1 jan 1987 ano
38.429
+0.834
2.22%
1 jan 1988 ano
50.417
+11.988
31.2%
1 jan 1989 ano
60.182
+9.765
19.37%
1 jan 1990 ano
64.945
+4.763
7.92%
1 jan 1991 ano
76.307
+11.362
17.49%
1 jan 1992 ano
84.561
+8.254
10.82%
1 jan 1993 ano
85.762
+1.201
1.42%
1 jan 1994 ano
83.719
-2.043
-2.38%
1 jan 1995 ano
69.611
-14.108
-16.85%
1 jan 1996 ano
80.163
+10.552
15.16%
1 jan 1997 ano
85.908
+5.745
7.17%
1 jan 1998 ano
88.612
+2.704
3.15%
1 jan 1999 ano
89.432
+0.819
0.92%
1 jan 2000 ano
89.499
+0.067
0.08%
1 jan 2001 ano
90.311
+0.812
0.91%
1 jan 2002 ano
88.866
-1.445
-1.6%
1 jan 2003 ano
93.858
+4.992
5.62%
1 jan 2004 ano
85.21
-8.648
-9.21%
1 jan 2005 ano
78.055
-7.154
-8.4%
1 jan 2006 ano
82.555
+4.5
5.77%
1 jan 2007 ano
90.117
+7.562
9.16%
1 jan 2008 ano
86.14
-3.977
-4.41%
1 jan 2009 ano
86.871
+0.731
0.85%
1 jan 2010 ano
82.68
-4.191
-4.82%
1 jan 2011 ano
89.025
+6.345
7.67%
1 jan 2012 ano
84.215
-4.81
-5.4%
1 jan 2013 ano
79.874
-4.341
-5.15%
1 jan 2014 ano
79.325
-0.548
-0.69%
1 jan 2015 ano
78.046
-1.279
-1.61%
1 jan 2016 ano
76.004
-2.042
-2.62%
Classificação de países por estatísticas atuais por anos


Comentários: