29
/pt/
pt
AIzaSyAYiBZKx7MnpbEhh9jyipgxe19OcubqV5w
April 1, 2024
216183
Pakistan
PAK
true
2
1
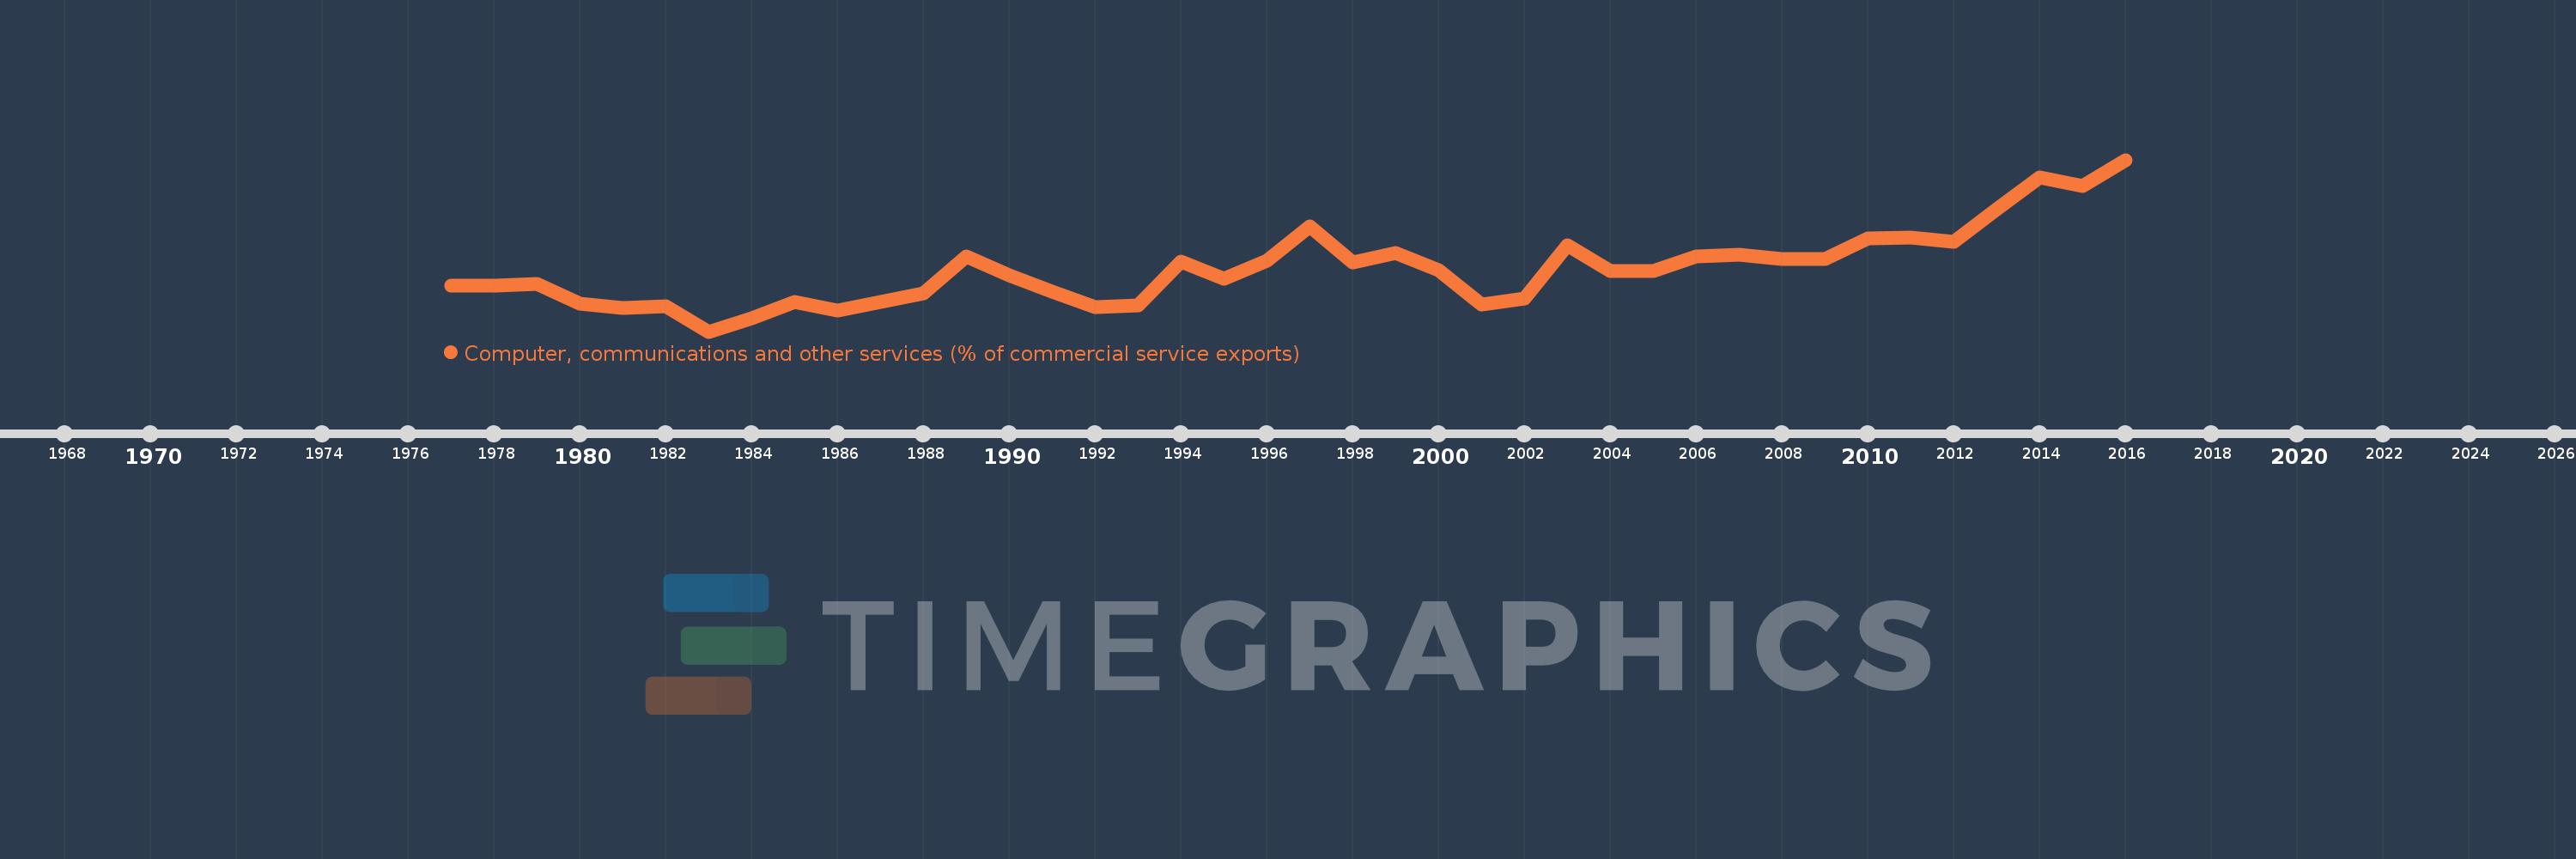
Computer, communications and other services (% of commercial service exports)
2016,2015,2014,2013,2012,2011,2010,2009,2008,2007,2006,2005,2004,2003,2002,2001,2000,1999,1998,1997,1996,1995,1994,1993,1992,1991,1990,1989,1988,1987,1986,1985,1984,1983,1982,1981,1980,1979,1978,1977
Estas estatísticas em outros países:
AfghanistanAlbaniaAlgeriaAngolaAntigua and BarbudaArab WorldArgentinaArmeniaArubaAustraliaAustriaAzerbaijanBahamas, TheBahrainBangladeshBarbadosBelarusBelgiumBelizeBeninBermudaBhutanBoliviaBosnia and HerzegovinaBotswanaBrazilBrunei DarussalamBulgariaBurkina FasoBurundiCabo VerdeCambodiaCameroonCanadaCaribbean small statesCentral African RepublicCentral Europe and the BalticsChadChileChinaColombiaComorosCongo, Dem. Rep.Congo, Rep.Costa RicaCote d'IvoireCroatiaCuracaoCyprusCzech RepublicDenmarkDjiboutiDominicaDominican RepublicEarly-demographic dividendEast Asia & PacificEast Asia & Pacific (excluding high income)East Asia & Pacific (IDA & IBRD countries)EcuadorEgypt, Arab Rep.El SalvadorEritreaEstoniaEthiopiaEuro areaEurope & Central AsiaEurope & Central Asia (excluding high income)Europe & Central Asia (IDA & IBRD countries)European UnionFaroe IslandsFijiFinlandFragile and conflict affected situationsFranceFrench PolynesiaGabonGambia, TheGeorgiaGermanyGhanaGreeceGrenadaGuatemalaGuineaGuinea-BissauGuyanaHaitiHeavily indebted poor countries (HIPC)High incomeHondurasHong Kong SAR, ChinaHungaryIBRD onlyIcelandIDA & IBRD totalIDA onlyIDA totalIndiaIndonesiaIran, Islamic Rep.IraqIrelandIsraelItalyJamaicaJapanJordanKazakhstanKenyaKiribatiKorea, Rep.KosovoKuwaitKyrgyz RepublicLao PDRLate-demographic dividendLatin America & Caribbean Latin America & Caribbean (excluding high income)Latin America & the Caribbean (IDA & IBRD countries)LatviaLeast developed countries: UN classificationLebanonLesothoLiberiaLibyaLithuaniaLow & middle incomeLow incomeLower middle incomeLuxembourgMacao SAR, ChinaMacedonia, FYRMadagascarMalawiMalaysiaMaldivesMaliMaltaMarshall IslandsMauritaniaMauritiusMexicoMicronesia, Fed. Sts.Middle East & North AfricaMiddle East & North Africa (excluding high income)Middle East & North Africa (IDA & IBRD countries)Middle incomeMoldovaMongoliaMontenegroMoroccoMozambiqueMyanmarNamibiaNepalNetherlandsNew CaledoniaNew ZealandNicaraguaNigerNigeriaNorth AmericaNorwayOECD membersOmanOther small statesPacific island small statesPakistanPalauPanamaPapua New GuineaParaguayPeruPhilippinesPolandPortugalPost-demographic dividendPre-demographic dividendQatarRomaniaRussian FederationRwandaSamoaSao Tome and PrincipeSaudi ArabiaSenegalSerbiaSeychellesSierra LeoneSingaporeSint Maarten (Dutch part)Slovak RepublicSloveniaSmall statesSolomon IslandsSouth AfricaSouth AsiaSouth Asia (IDA & IBRD)South SudanSpainSri LankaSt. Kitts and NevisSt. LuciaSt. Vincent and the GrenadinesSub-Saharan Africa Sub-Saharan Africa (excluding high income)Sub-Saharan Africa (IDA & IBRD countries)SudanSurinameSwazilandSwedenSwitzerlandSyrian Arab RepublicTajikistanTanzaniaThailandTimor-LesteTogoTongaTrinidad and TobagoTunisiaTurkeyTuvaluUgandaUkraineUnited KingdomUnited StatesUpper middle incomeUruguayVanuatuVenezuela, RBWest Bank and GazaWorldYemen, Rep.ZambiaZimbabwe Linha do tempo:
Nesta escala de tempo está apresentado um gráfico de 1977 ano até 2016 ano Pakistan. Dados de 1976 ano ausente. O número de observações reais por data: 40.
Fonte (nome):
Indicadores de desenvolvimento mundial
Fonte (organização):
International Monetary Fund, Balance of Payments Statistics Yearbook and data files.
Categorias:
Private Sector, Trade
Foi atualizado:
23 abr 2017 ano
Indicadores de alterações dos valores ao longo dos anos
Mínimo:
19.43
1 jan 1983 ano
Máximo:
53.08
1 jan 2016 ano
Na data de observação
Valor
Mudança absoluta
A alteração em relação ao valor anterior
1 jan 1977 ano
28.413
+28.413
0.0%
1 jan 1978 ano
28.466
+0.053
0.19%
1 jan 1979 ano
28.832
+0.366
1.28%
1 jan 1980 ano
24.819
-4.013
-13.92%
1 jan 1981 ano
24.049
-0.77
-3.1%
1 jan 1982 ano
24.441
+0.392
1.63%
1 jan 1983 ano
19.43
-5.011
-20.5%
1 jan 1984 ano
22.054
+2.624
13.51%
1 jan 1985 ano
25.273
+3.219
14.59%
1 jan 1986 ano
23.56
-1.713
-6.78%
1 jan 1987 ano
25.186
+1.626
6.9%
1 jan 1988 ano
26.997
+1.811
7.19%
1 jan 1989 ano
34.135
+7.138
26.44%
1 jan 1990 ano
30.44
-3.695
-10.82%
1 jan 1991 ano
27.323
-3.117
-10.24%
1 jan 1992 ano
24.276
-3.048
-11.15%
1 jan 1993 ano
24.594
+0.318
1.31%
1 jan 1994 ano
33.084
+8.49
34.52%
1 jan 1995 ano
29.805
-3.279
-9.91%
1 jan 1996 ano
33.388
+3.584
12.02%
1 jan 1997 ano
40.084
+6.696
20.05%
1 jan 1998 ano
32.999
-7.085
-17.67%
1 jan 1999 ano
34.817
+1.818
5.51%
1 jan 2000 ano
31.532
-3.286
-9.44%
1 jan 2001 ano
24.759
-6.773
-21.48%
1 jan 2002 ano
25.852
+1.094
4.42%
1 jan 2003 ano
36.364
+10.511
40.66%
1 jan 2004 ano
31.375
-4.988
-13.72%
1 jan 2005 ano
31.352
-0.023
-0.07%
1 jan 2006 ano
34.105
+2.753
8.78%
1 jan 2007 ano
34.417
+0.312
0.91%
1 jan 2008 ano
33.73
-0.687
-2.0%
1 jan 2009 ano
33.611
-0.119
-0.35%
1 jan 2010 ano
37.629
+4.017
11.95%
1 jan 2011 ano
37.803
+0.174
0.46%
1 jan 2012 ano
36.968
-0.834
-2.21%
1 jan 2013 ano
43.339
+6.37
17.23%
1 jan 2014 ano
49.652
+6.314
14.57%
1 jan 2015 ano
47.976
-1.676
-3.38%
1 jan 2016 ano
53.08
+5.104
10.64%
Classificação de países por estatísticas atuais por anos


Comentários: