29
/pt/
pt
AIzaSyAYiBZKx7MnpbEhh9jyipgxe19OcubqV5w
April 1, 2024
276930
United States
USA
true
2
1
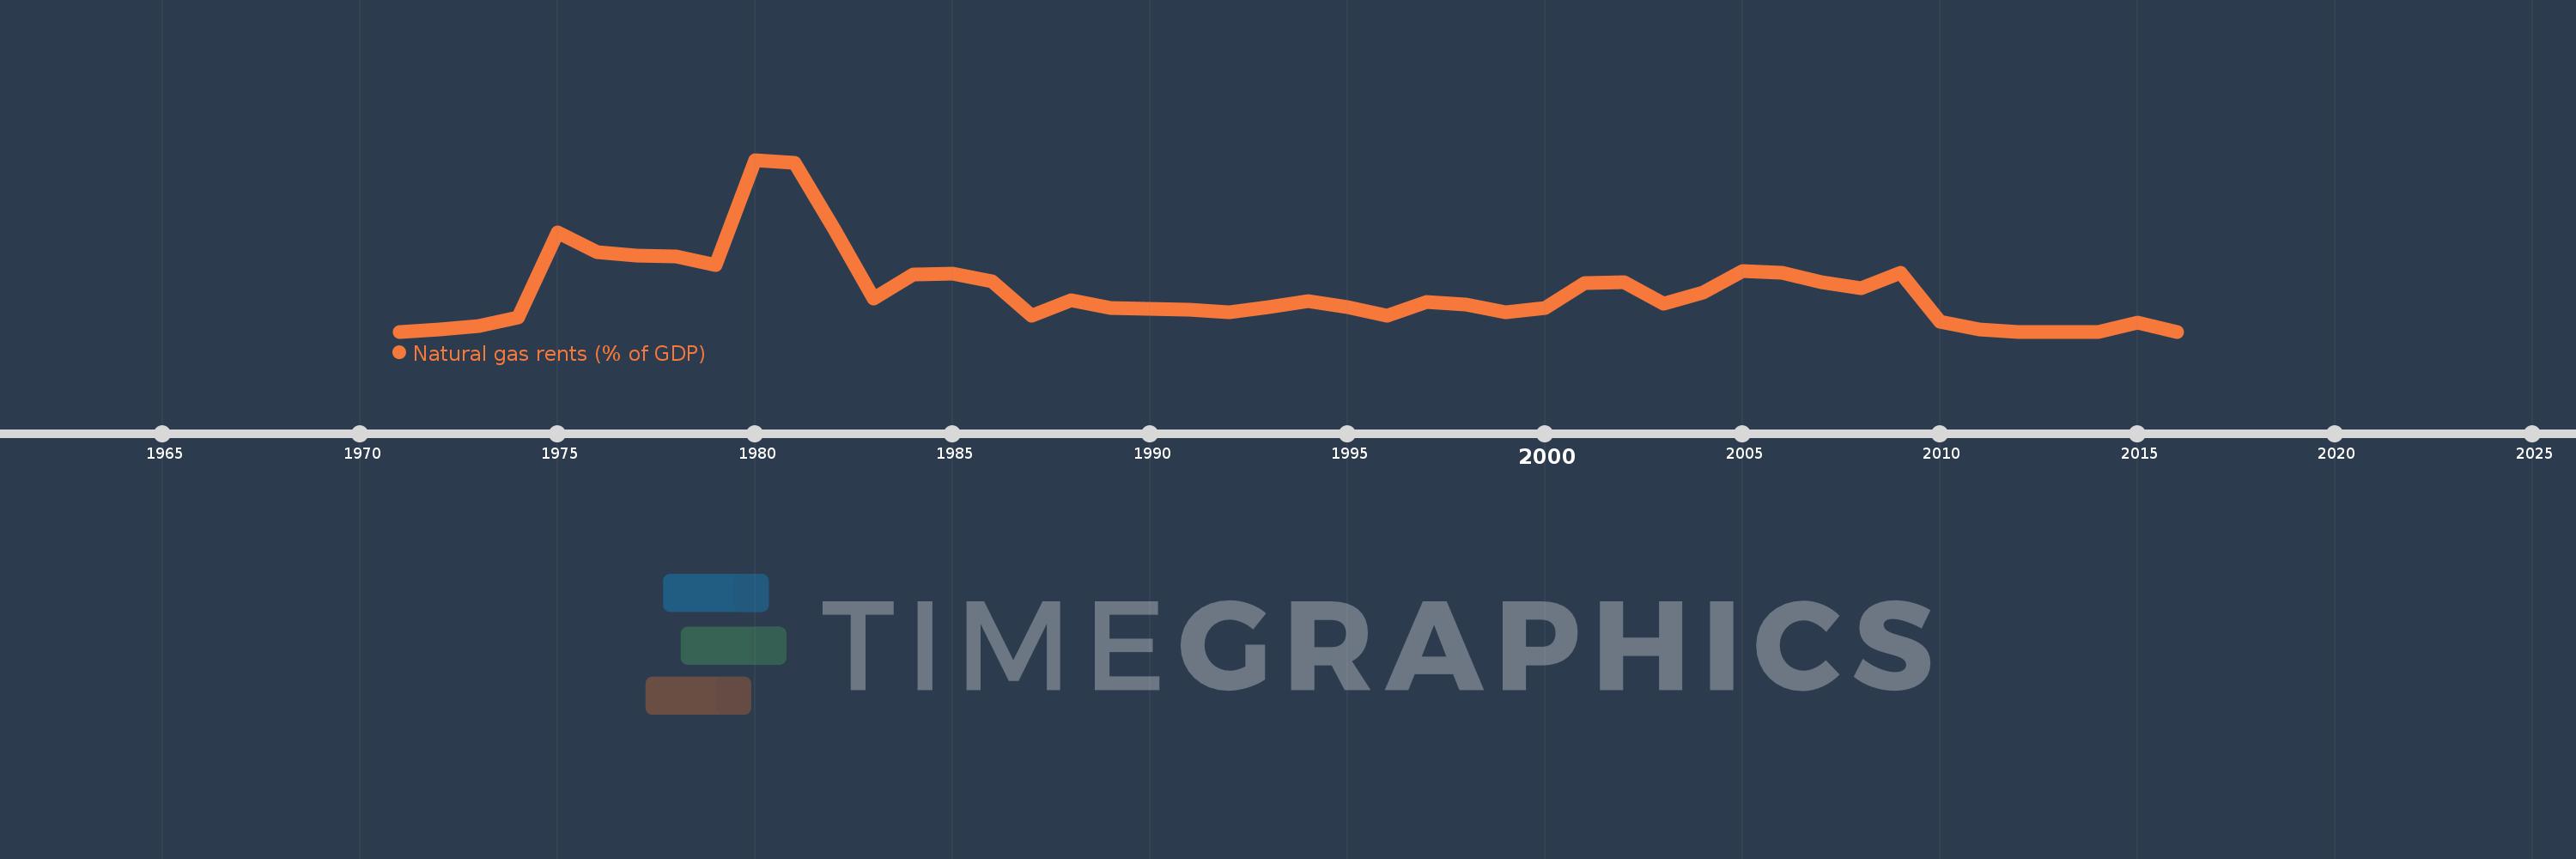
Natural gas rents (% of GDP)
2016,2015,2014,2013,2012,2011,2010,2009,2008,2007,2006,2005,2004,2003,2002,2001,2000,1999,1998,1997,1996,1995,1994,1993,1992,1991,1990,1989,1988,1987,1986,1985,1984,1983,1982,1981,1980,1979,1978,1977,1976,1975,1974,1973,1972,1971
Estas estatísticas em outros países:
Linha do tempo:
Nesta escala de tempo está apresentado um gráfico de 1971 ano até 2016 ano United States. Dados de 1970 ano ausente. O número de observações reais por data: 46.
Fonte (nome):
Indicadores de desenvolvimento mundial
Fonte (organização):
Estimates based on sources and methods described in "The Changing Wealth of Nations: Measuring Sustainable Development in the New Millennium" (World Bank, 2011).
Categorias:
Energy & Mining, Environment
Foi atualizado:
23 abr 2017 ano
Indicadores de alterações dos valores ao longo dos anos
Máximo:
1.941
1 jan 1980 ano
Na data de observação
Valor
Mudança absoluta
A alteração em relação ao valor anterior
1 jan 1971 ano
0.0
0.0
0.0%
1 jan 1972 ano
0.02
+0.02
%
1 jan 1973 ano
0.064
+0.044
218.39%
1 jan 1974 ano
0.156
+0.092
143.59%
1 jan 1975 ano
1.125
+0.969
619.31%
1 jan 1976 ano
0.899
-0.226
-20.06%
1 jan 1977 ano
0.862
-0.037
-4.14%
1 jan 1978 ano
0.852
-0.011
-1.22%
1 jan 1979 ano
0.753
-0.099
-11.59%
1 jan 1980 ano
1.941
+1.188
157.76%
1 jan 1981 ano
1.91
-0.031
-1.6%
1 jan 1982 ano
1.162
-0.748
-39.17%
1 jan 1983 ano
0.369
-0.793
-68.27%
1 jan 1984 ano
0.645
+0.276
74.88%
1 jan 1985 ano
0.659
+0.014
2.23%
1 jan 1986 ano
0.566
-0.093
-14.18%
1 jan 1987 ano
0.183
-0.383
-67.72%
1 jan 1988 ano
0.359
+0.177
96.9%
1 jan 1989 ano
0.271
-0.088
-24.59%
1 jan 1990 ano
0.258
-0.013
-4.84%
1 jan 1991 ano
0.248
-0.01
-3.87%
1 jan 1992 ano
0.215
-0.033
-13.16%
1 jan 1993 ano
0.273
+0.058
26.84%
1 jan 1994 ano
0.348
+0.075
27.53%
1 jan 1995 ano
0.278
-0.07
-20.06%
1 jan 1996 ano
0.184
-0.094
-33.85%
1 jan 1997 ano
0.339
+0.155
84.05%
1 jan 1998 ano
0.301
-0.038
-11.08%
1 jan 1999 ano
0.219
-0.082
-27.23%
1 jan 2000 ano
0.27
+0.05
23.02%
1 jan 2001 ano
0.547
+0.277
102.66%
1 jan 2002 ano
0.56
+0.013
2.33%
1 jan 2003 ano
0.316
-0.243
-43.49%
1 jan 2004 ano
0.444
+0.128
40.48%
1 jan 2005 ano
0.687
+0.243
54.59%
1 jan 2006 ano
0.669
-0.018
-2.66%
1 jan 2007 ano
0.556
-0.112
-16.82%
1 jan 2008 ano
0.49
-0.066
-11.83%
1 jan 2009 ano
0.663
+0.173
35.3%
1 jan 2010 ano
0.109
-0.555
-83.63%
1 jan 2011 ano
0.024
-0.084
-77.55%
1 jan 2012 ano
0.0
-0.024
-100.0%
1 jan 2016 ano
0.0
-0.1
-100.0%
Classificação de países por estatísticas atuais por anos


Comentários: