30
/pt/
AIzaSyAYiBZKx7MnpbEhh9jyipgxe19OcubqV5w
April 1, 2024
80863
Belarus
BLR
true
2
1
Natural gas rents (% of GDP)
2015,2014,2013,2012,2011,2010,2009,2008,2007,2006,2005,2004,2003,2002,2001,2000,1999,1998,1997,1996,1995,1994,1993,1992,1991
Download
Biblioteca de estatísticas globais →Belarus →

Natural gas rents (% of GDP)

Estas estatísticas em outros países:

AfghanistanAlbaniaAlgeriaAngolaArab WorldArgentinaArmeniaAustraliaAustriaAzerbaijanBahrainBangladeshBarbadosBelarusBelgiumBelizeBeninBoliviaBosnia and HerzegovinaBotswanaBrazilBrunei DarussalamBulgariaCambodiaCameroonCanadaCaribbean small statesCentral Europe and the BalticsChadChileChinaColombiaCongo, Dem. Rep.Congo, Rep.Costa RicaCote d'IvoireCroatiaCubaCyprusCzech RepublicDenmarkDominican RepublicEarly-demographic dividendEast Asia & PacificEast Asia & Pacific (excluding high income)East Asia & Pacific (IDA & IBRD countries)EcuadorEgypt, Arab Rep.El SalvadorEquatorial GuineaEritreaEstoniaEthiopiaEuro areaEurope & Central AsiaEurope & Central Asia (excluding high income)Europe & Central Asia (IDA & IBRD countries)European UnionFinlandFragile and conflict affected situationsFranceGabonGeorgiaGermanyGhanaGreeceGuatemalaHaitiHeavily indebted poor countries (HIPC)High incomeHondurasHungaryIBRD onlyIcelandIDA & IBRD totalIDA blendIDA onlyIDA totalIndiaIndonesiaIran, Islamic Rep.IraqIrelandIsraelItalyJamaicaJapanJordanKazakhstanKenyaKorea, Rep.KosovoKuwaitKyrgyz RepublicLate-demographic dividendLatin America & Caribbean Latin America & Caribbean (excluding high income)Latin America & the Caribbean (IDA & IBRD countries)LatviaLeast developed countries: UN classificationLebanonLibyaLithuaniaLow & middle incomeLow incomeLower middle incomeLuxembourgMacedonia, FYRMalaysiaMaltaMauritiusMexicoMiddle East & North AfricaMiddle East & North Africa (excluding high income)Middle East & North Africa (IDA & IBRD countries)Middle incomeMoldovaMongoliaMontenegroMoroccoMozambiqueMyanmarNamibiaNepalNetherlandsNew ZealandNicaraguaNigerNigeriaNorth AmericaNorwayOECD membersOmanOther small statesPakistanPanamaPapua New GuineaParaguayPeruPhilippinesPolandPortugalPost-demographic dividendPre-demographic dividendQatarRomaniaRussian FederationSaudi ArabiaSenegalSerbiaSingaporeSlovak RepublicSloveniaSmall statesSouth AfricaSouth AsiaSouth Asia (IDA & IBRD)South SudanSpainSri LankaSub-Saharan Africa Sub-Saharan Africa (excluding high income)Sub-Saharan Africa (IDA & IBRD countries)SudanSwedenSwitzerlandSyrian Arab RepublicTajikistanTanzaniaThailandTimor-LesteTogoTrinidad and TobagoTunisiaTurkeyTurkmenistanUkraineUnited Arab EmiratesUnited KingdomUnited StatesUpper middle incomeUruguayUzbekistanVenezuela, RBVietnamWest Bank and GazaWorldYemen, Rep.ZambiaZimbabwe

Linha do tempo:

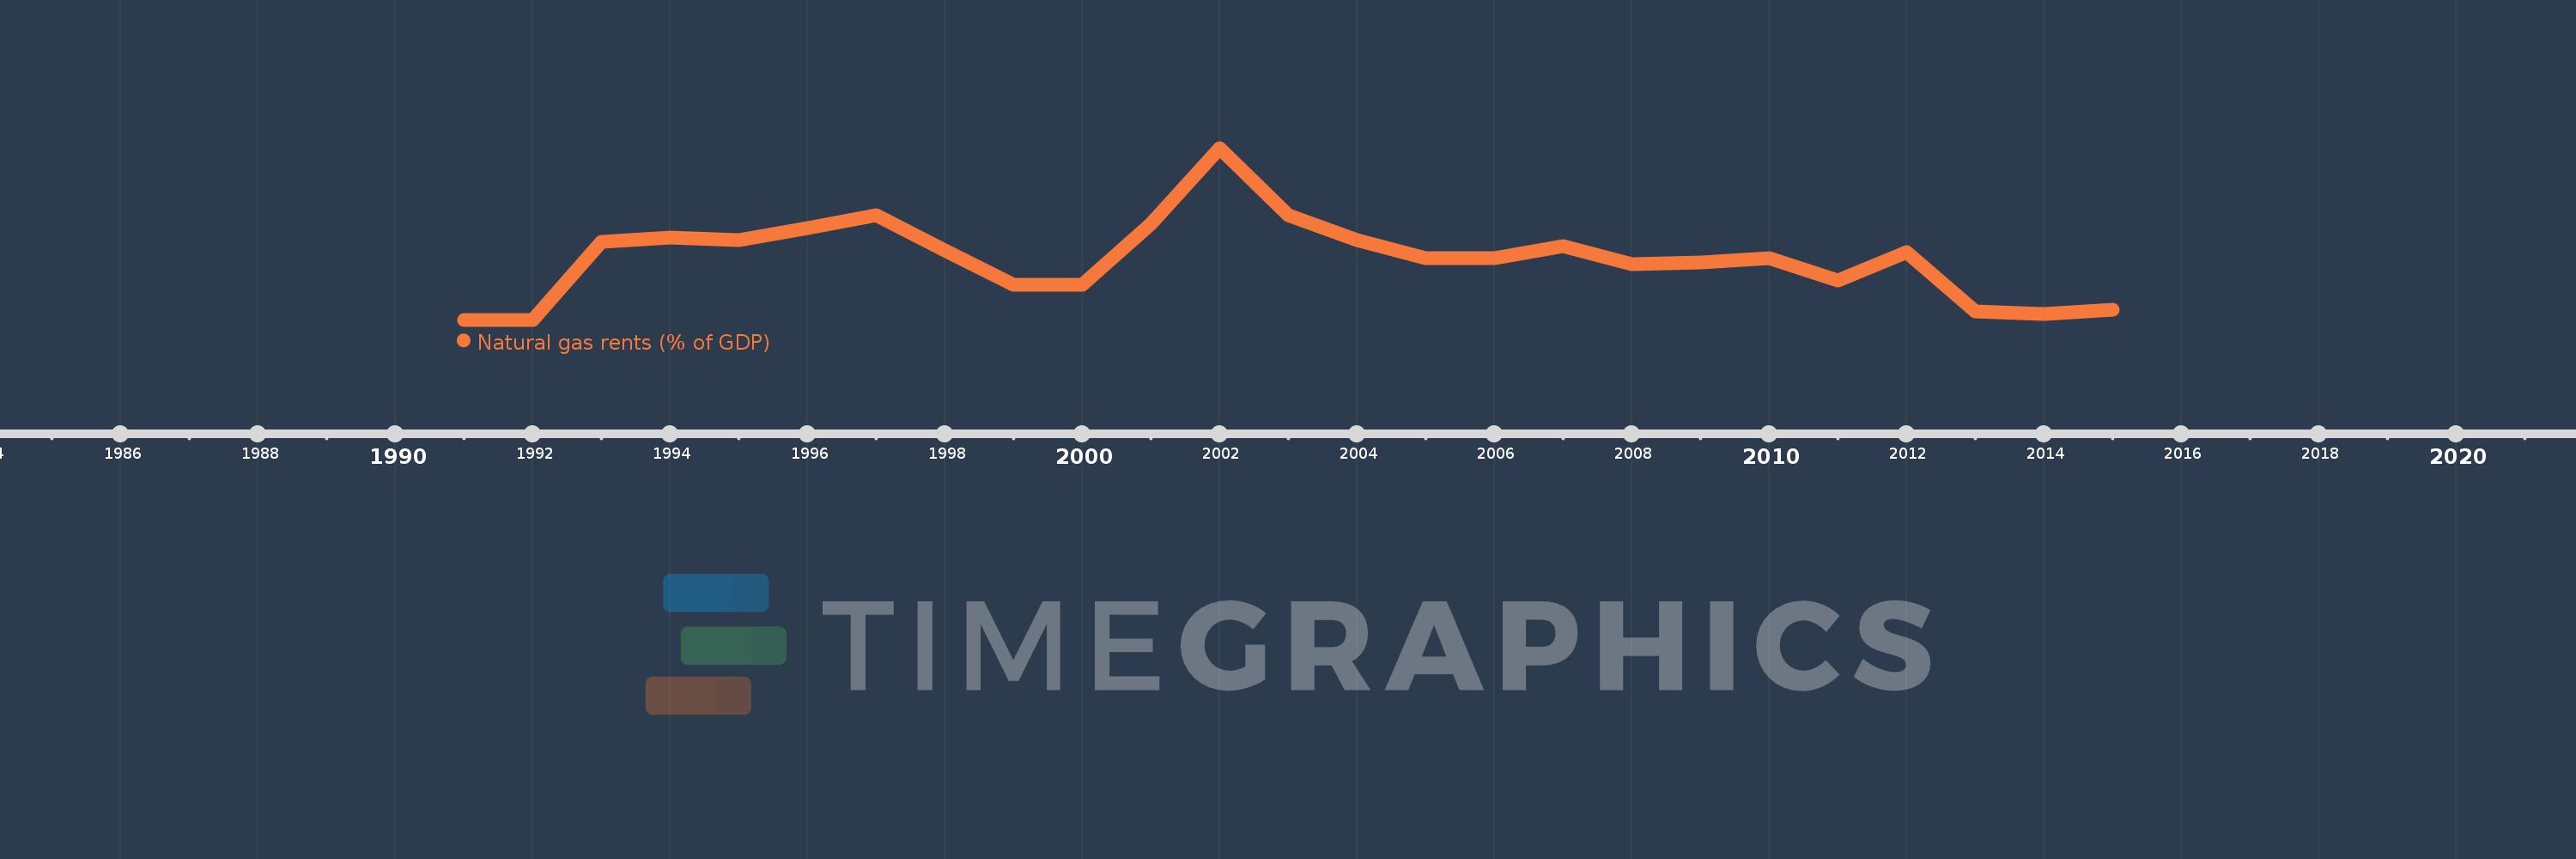
Nesta escala de tempo está apresentado um gráfico de 1991 ano até 2015 ano Belarus. Dados de 1990 ano ausente. O número de observações reais por data: 25.

Fonte (nome):

Indicadores de desenvolvimento mundial

Fonte (organização):

Estimates based on sources and methods described in "The Changing Wealth of Nations: Measuring Sustainable Development in the New Millennium" (World Bank, 2011).

Categorias:

Energy & Mining, Environment

Foi atualizado:

23 abr 2017 ano

Indicadores de alterações dos valores ao longo dos anos

Em média:
0.03
Mínimo:
0.0
1 jan 1991 ano
Máximo:
0.084
1 jan 2002 ano
Na data de observação
Valor
Mudança absoluta
A alteração em relação ao valor anterior
1 jan 1991 ano
0.0
0.0
0.0%
1 jan 1992 ano
0.0
0.0
%
1 jan 1993 ano
0.038
+0.038
%
1 jan 1994 ano
0.04
+0.003
7.06%
1 jan 1995 ano
0.039
-0.002
-3.76%
1 jan 1996 ano
0.045
+0.007
16.72%
1 jan 1997 ano
0.051
+0.005
11.67%
1 jan 1998 ano
0.034
-0.017
-33.26%
1 jan 1999 ano
0.017
-0.017
-49.89%
1 jan 2000 ano
0.017
+0.0
0.65%
1 jan 2001 ano
0.047
+0.029
172.61%
1 jan 2002 ano
0.084
+0.037
80.19%
1 jan 2003 ano
0.051
-0.033
-39.38%
1 jan 2004 ano
0.039
-0.012
-22.89%
1 jan 2005 ano
0.03
-0.009
-22.64%
1 jan 2006 ano
0.03
0.0
-0.16%
1 jan 2007 ano
0.036
+0.006
18.83%
1 jan 2008 ano
0.027
-0.009
-24.2%
1 jan 2009 ano
0.028
+0.001
3.82%
1 jan 2010 ano
0.03
+0.002
7.34%
1 jan 2011 ano
0.019
-0.012
-38.29%
1 jan 2012 ano
0.033
+0.014
76.38%
1 jan 2013 ano
0.004
-0.03
-89.26%
1 jan 2014 ano
0.003
0.0
-7.3%
1 jan 2015 ano
0.005
+0.002
47.6%

Classificação de países por estatísticas atuais por anos