29
/pt/
pt
AIzaSyAYiBZKx7MnpbEhh9jyipgxe19OcubqV5w
April 1, 2024
270751
Turkmenistan
TKM
true
2
1
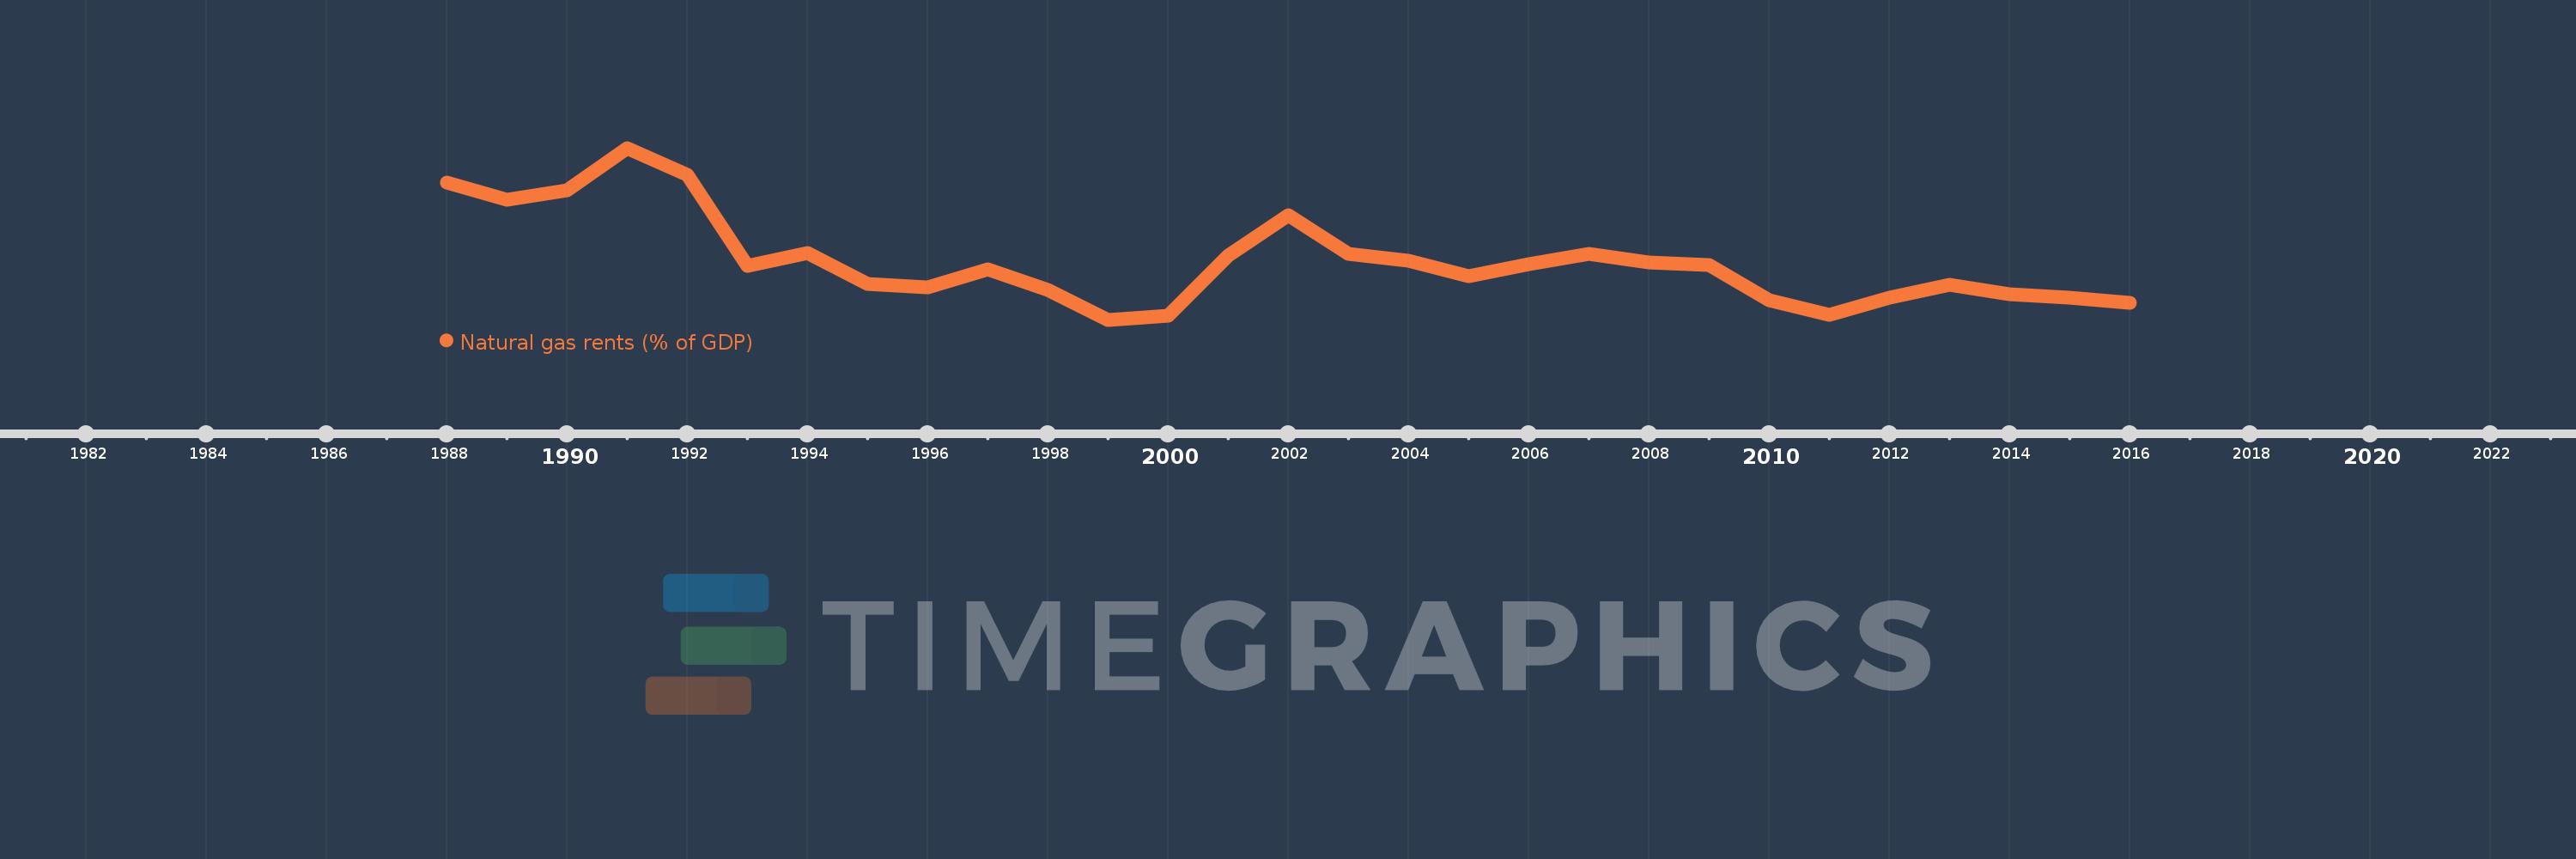
Natural gas rents (% of GDP)
2016,2015,2014,2013,2012,2011,2010,2009,2008,2007,2006,2005,2004,2003,2002,2001,2000,1999,1998,1997,1996,1995,1994,1993,1992,1991,1990,1989,1988
Estas estatísticas em outros países:
Linha do tempo:
Nesta escala de tempo está apresentado um gráfico de 1988 ano até 2016 ano Turkmenistan. Dados de 1987 ano ausente. O número de observações reais por data: 29.
Fonte (nome):
Indicadores de desenvolvimento mundial
Fonte (organização):
Estimates based on sources and methods described in "The Changing Wealth of Nations: Measuring Sustainable Development in the New Millennium" (World Bank, 2011).
Categorias:
Energy & Mining, Environment
Foi atualizado:
23 abr 2017 ano
Indicadores de alterações dos valores ao longo dos anos
Mínimo:
5.993
1 jan 1999 ano
Máximo:
100.824
1 jan 1991 ano
Na data de observação
Valor
Mudança absoluta
A alteração em relação ao valor anterior
1 jan 1988 ano
81.701
+81.701
0.0%
1 jan 1989 ano
72.292
-9.408
-11.52%
1 jan 1990 ano
77.459
+5.167
7.15%
1 jan 1991 ano
100.824
+23.365
30.16%
1 jan 1992 ano
86.071
-14.754
-14.63%
1 jan 1993 ano
35.64
-50.431
-58.59%
1 jan 1994 ano
42.889
+7.249
20.34%
1 jan 1995 ano
25.888
-17.001
-39.64%
1 jan 1996 ano
23.914
-1.974
-7.63%
1 jan 1997 ano
33.855
+9.942
41.57%
1 jan 1998 ano
22.296
-11.559
-34.14%
1 jan 1999 ano
5.993
-16.303
-73.12%
1 jan 2000 ano
8.176
+2.182
36.41%
1 jan 2001 ano
41.532
+33.356
408.0%
1 jan 2002 ano
63.857
+22.325
53.76%
1 jan 2003 ano
42.339
-21.519
-33.7%
1 jan 2004 ano
38.554
-3.785
-8.94%
1 jan 2005 ano
30.151
-8.403
-21.8%
1 jan 2006 ano
36.731
+6.58
21.82%
1 jan 2007 ano
42.199
+5.468
14.89%
1 jan 2008 ano
37.405
-4.794
-11.36%
1 jan 2009 ano
36.117
-1.289
-3.45%
1 jan 2010 ano
16.843
-19.273
-53.36%
1 jan 2011 ano
8.541
-8.303
-49.29%
1 jan 2012 ano
18.369
+9.829
115.08%
1 jan 2013 ano
25.31
+6.94
37.78%
1 jan 2014 ano
20.092
-5.217
-20.61%
1 jan 2015 ano
18.352
-1.74
-8.66%
1 jan 2016 ano
15.197
-3.156
-17.19%
Classificação de países por estatísticas atuais por anos


Comentários: