29
/pt/
pt
AIzaSyAYiBZKx7MnpbEhh9jyipgxe19OcubqV5w
April 1, 2024
55744
Pre-demographic dividend
PRE
false
2
1
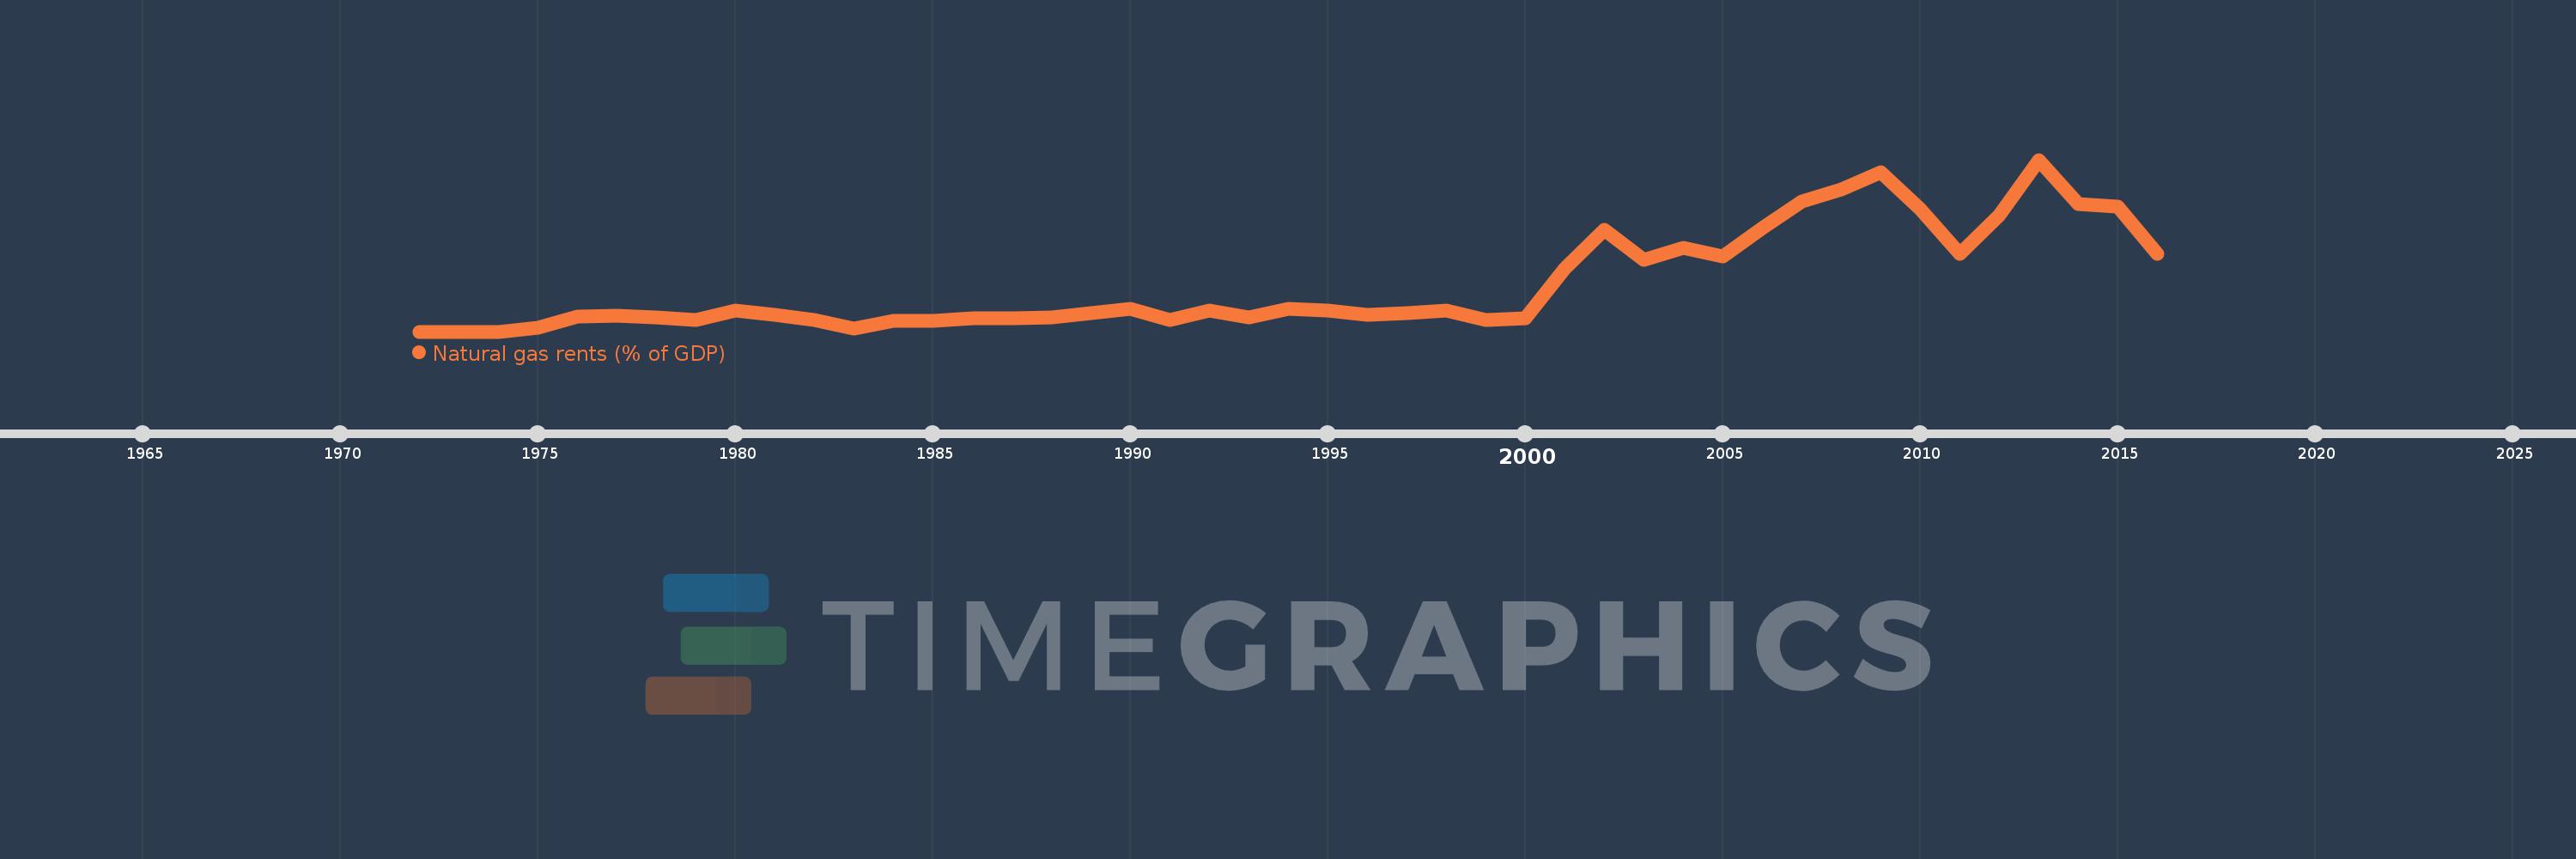
Natural gas rents (% of GDP)
2016,2015,2014,2013,2012,2011,2010,2009,2008,2007,2006,2005,2004,2003,2002,2001,2000,1999,1998,1997,1996,1995,1994,1993,1992,1991,1990,1989,1988,1987,1986,1985,1984,1983,1982,1981,1980,1979,1978,1977,1976,1975,1974,1973,1972
Estas estatísticas em outros países:
Linha do tempo:
Nesta escala de tempo está apresentado um gráfico de 1972 ano até 2016 ano Pre-demographic dividend. Dados de 1971 ano ausente. O número de observações reais por data: 45.
Fonte (nome):
Indicadores de desenvolvimento mundial
Fonte (organização):
Estimates based on sources and methods described in "The Changing Wealth of Nations: Measuring Sustainable Development in the New Millennium" (World Bank, 2011).
Categorias:
Energy & Mining, Environment
Foi atualizado:
23 abr 2017 ano
Indicadores de alterações dos valores ao longo dos anos
Máximo:
0.383
1 jan 2013 ano
Na data de observação
Valor
Mudança absoluta
A alteração em relação ao valor anterior
1 jan 1972 ano
0.0
+0.0
0.0%
1 jan 1973 ano
0.0
+0.0
33.84%
1 jan 1974 ano
0.0
+0.0
188.52%
1 jan 1975 ano
0.009
+0.008
1.85 mil%
1 jan 1976 ano
0.034
+0.026
303.38%
1 jan 1977 ano
0.036
+0.001
3.98%
1 jan 1978 ano
0.032
-0.004
-11.19%
1 jan 1979 ano
0.026
-0.006
-19.11%
1 jan 1980 ano
0.047
+0.022
84.51%
1 jan 1981 ano
0.038
-0.009
-18.88%
1 jan 1982 ano
0.025
-0.013
-34.22%
1 jan 1983 ano
0.007
-0.018
-70.42%
1 jan 1984 ano
0.023
+0.016
212.54%
1 jan 1985 ano
0.024
+0.001
2.78%
1 jan 1986 ano
0.029
+0.005
22.63%
1 jan 1987 ano
0.029
0.0
-1.18%
1 jan 1988 ano
0.032
+0.002
8.42%
1 jan 1989 ano
0.041
+0.009
29.52%
1 jan 1990 ano
0.05
+0.009
22.6%
1 jan 1991 ano
0.026
-0.024
-48.45%
1 jan 1992 ano
0.046
+0.02
76.41%
1 jan 1993 ano
0.031
-0.014
-31.65%
1 jan 1994 ano
0.05
+0.019
62.04%
1 jan 1995 ano
0.046
-0.005
-9.6%
1 jan 1996 ano
0.037
-0.009
-19.32%
1 jan 1997 ano
0.042
+0.005
13.48%
1 jan 1998 ano
0.046
+0.004
10.41%
1 jan 1999 ano
0.025
-0.021
-45.58%
1 jan 2000 ano
0.03
+0.005
19.97%
1 jan 2001 ano
0.14
+0.11
366.02%
1 jan 2002 ano
0.226
+0.086
61.12%
1 jan 2003 ano
0.159
-0.067
-29.83%
1 jan 2004 ano
0.186
+0.027
17.32%
1 jan 2005 ano
0.167
-0.019
-10.01%
1 jan 2006 ano
0.23
+0.062
37.13%
1 jan 2007 ano
0.291
+0.062
26.87%
1 jan 2008 ano
0.317
+0.026
8.99%
1 jan 2009 ano
0.355
+0.038
11.96%
1 jan 2010 ano
0.272
-0.084
-23.55%
1 jan 2011 ano
0.174
-0.097
-35.8%
1 jan 2012 ano
0.259
+0.084
48.33%
1 jan 2013 ano
0.383
+0.124
47.87%
1 jan 2014 ano
0.285
-0.097
-25.46%
1 jan 2015 ano
0.278
-0.007
-2.47%
1 jan 2016 ano
0.173
-0.105
-37.63%
Classificação de países por estatísticas atuais por anos


Comentários: