29
/pt/
pt
AIzaSyAYiBZKx7MnpbEhh9jyipgxe19OcubqV5w
April 1, 2024
77396
Bahrain
BHR
true
2
1
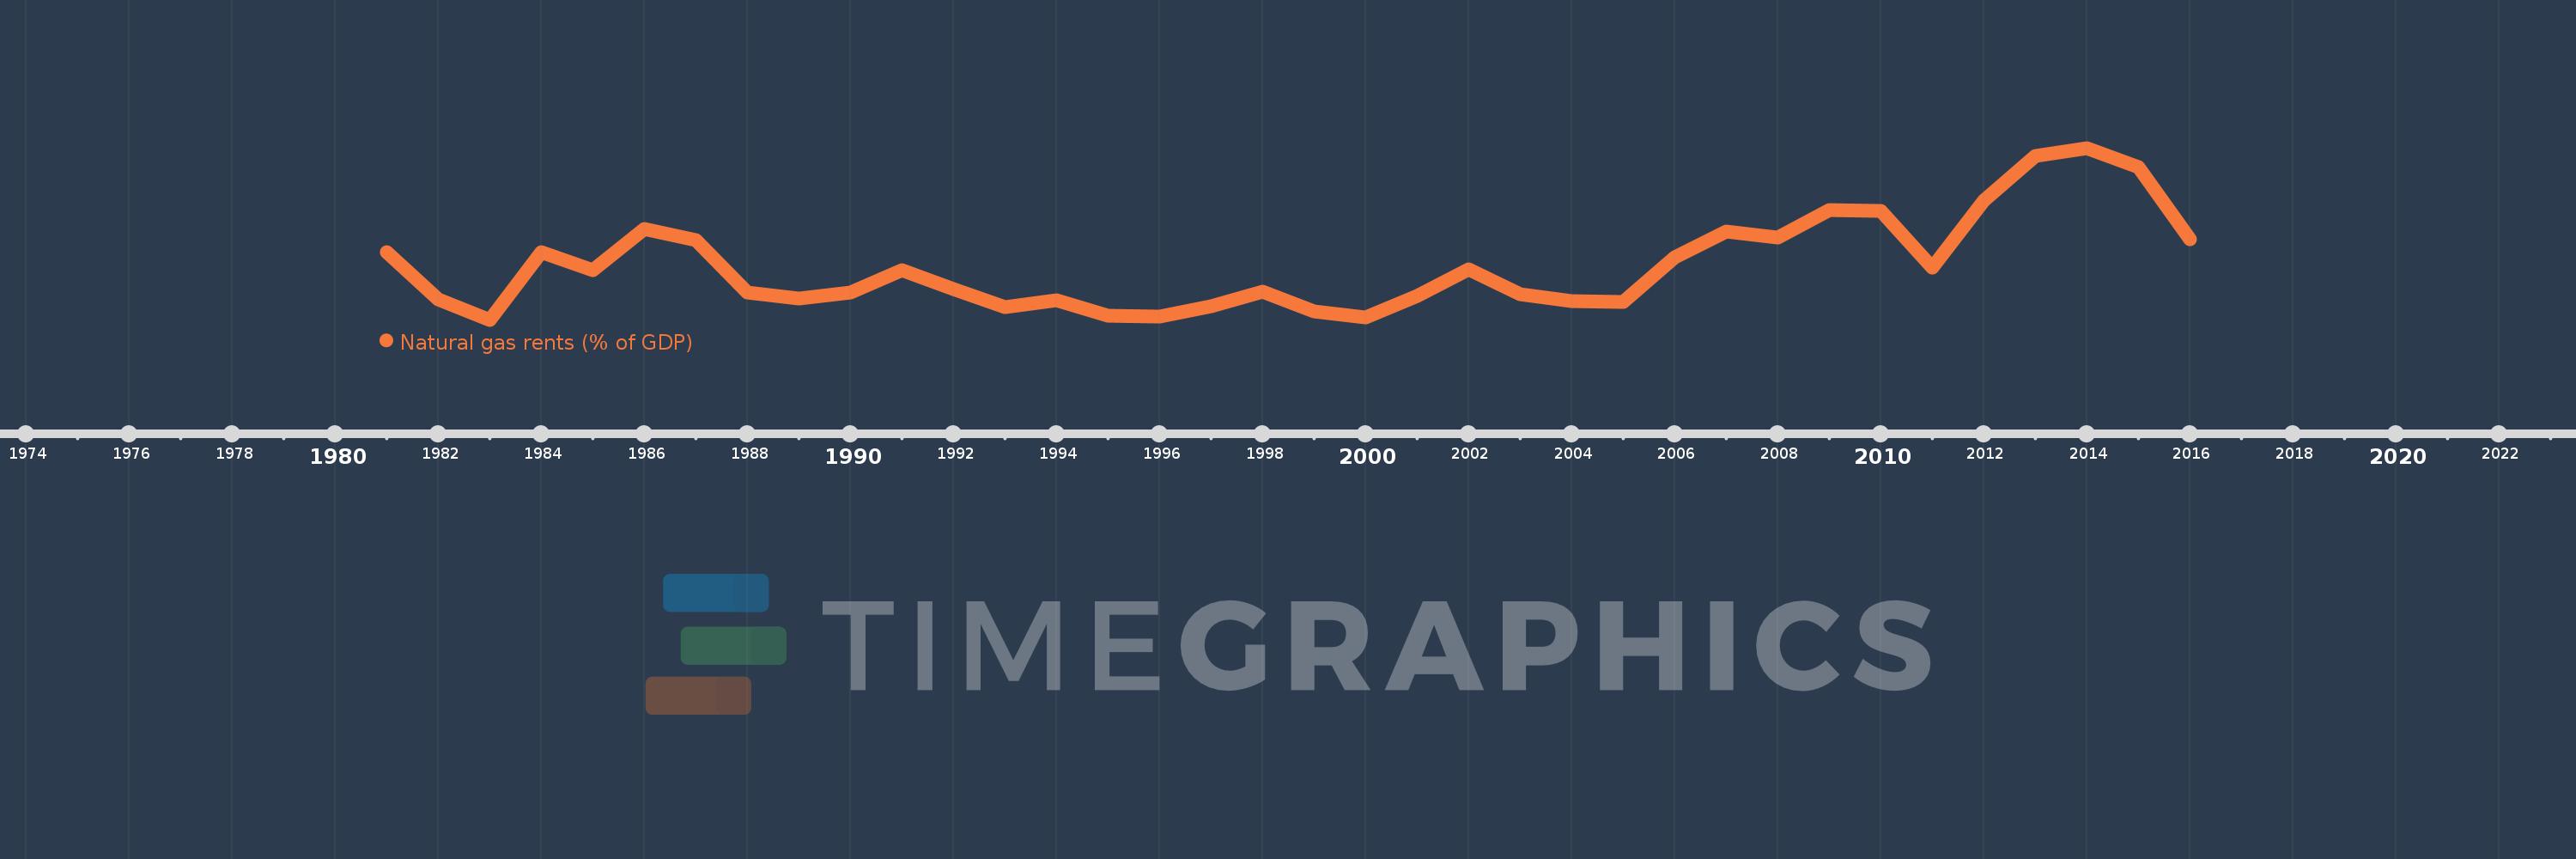
Natural gas rents (% of GDP)
2016,2015,2014,2013,2012,2011,2010,2009,2008,2007,2006,2005,2004,2003,2002,2001,2000,1999,1998,1997,1996,1995,1994,1993,1992,1991,1990,1989,1988,1987,1986,1985,1984,1983,1982,1981
Estas estatísticas em outros países:
Linha do tempo:
Nesta escala de tempo está apresentado um gráfico de 1981 ano até 2016 ano Bahrain. Dados de 1980 ano ausente. O número de observações reais por data: 36.
Fonte (nome):
Indicadores de desenvolvimento mundial
Fonte (organização):
Estimates based on sources and methods described in "The Changing Wealth of Nations: Measuring Sustainable Development in the New Millennium" (World Bank, 2011).
Categorias:
Energy & Mining, Environment
Foi atualizado:
23 abr 2017 ano
Indicadores de alterações dos valores ao longo dos anos
Mínimo:
0.902
1 jan 1983 ano
Máximo:
4.071
1 jan 2014 ano
Na data de observação
Valor
Mudança absoluta
A alteração em relação ao valor anterior
1 jan 1981 ano
2.149
+2.149
0.0%
1 jan 1982 ano
1.281
-0.869
-40.41%
1 jan 1983 ano
0.902
-0.379
-29.6%
1 jan 1984 ano
2.153
+1.252
138.85%
1 jan 1985 ano
1.816
-0.337
-15.67%
1 jan 1986 ano
2.581
+0.765
42.14%
1 jan 1987 ano
2.372
-0.21
-8.12%
1 jan 1988 ano
1.398
-0.974
-41.06%
1 jan 1989 ano
1.294
-0.104
-7.46%
1 jan 1990 ano
1.404
+0.11
8.53%
1 jan 1991 ano
1.817
+0.413
29.43%
1 jan 1992 ano
1.463
-0.355
-19.52%
1 jan 1993 ano
1.136
-0.327
-22.32%
1 jan 1994 ano
1.261
+0.125
11.01%
1 jan 1995 ano
0.974
-0.287
-22.78%
1 jan 1996 ano
0.963
-0.011
-1.16%
1 jan 1997 ano
1.143
+0.18
18.69%
1 jan 1998 ano
1.417
+0.274
23.98%
1 jan 1999 ano
1.061
-0.356
-25.12%
1 jan 2000 ano
0.939
-0.122
-11.48%
1 jan 2001 ano
1.346
+0.407
43.35%
1 jan 2002 ano
1.827
+0.481
35.7%
1 jan 2003 ano
1.365
-0.462
-25.27%
1 jan 2004 ano
1.247
-0.118
-8.67%
1 jan 2005 ano
1.231
-0.016
-1.25%
1 jan 2006 ano
2.058
+0.827
67.14%
1 jan 2007 ano
2.528
+0.47
22.85%
1 jan 2008 ano
2.413
-0.115
-4.56%
1 jan 2009 ano
2.925
+0.512
21.23%
1 jan 2010 ano
2.906
-0.019
-0.65%
1 jan 2011 ano
1.861
-1.046
-35.98%
1 jan 2012 ano
3.096
+1.236
66.42%
1 jan 2013 ano
3.928
+0.832
26.88%
1 jan 2014 ano
4.071
+0.143
3.64%
1 jan 2015 ano
3.717
-0.355
-8.71%
1 jan 2016 ano
2.388
-1.328
-35.74%
Classificação de países por estatísticas atuais por anos


Comentários: