29
/pt/
pt
AIzaSyAYiBZKx7MnpbEhh9jyipgxe19OcubqV5w
April 1, 2024
25938
Central Europe and the Baltics
CEB
false
2
1
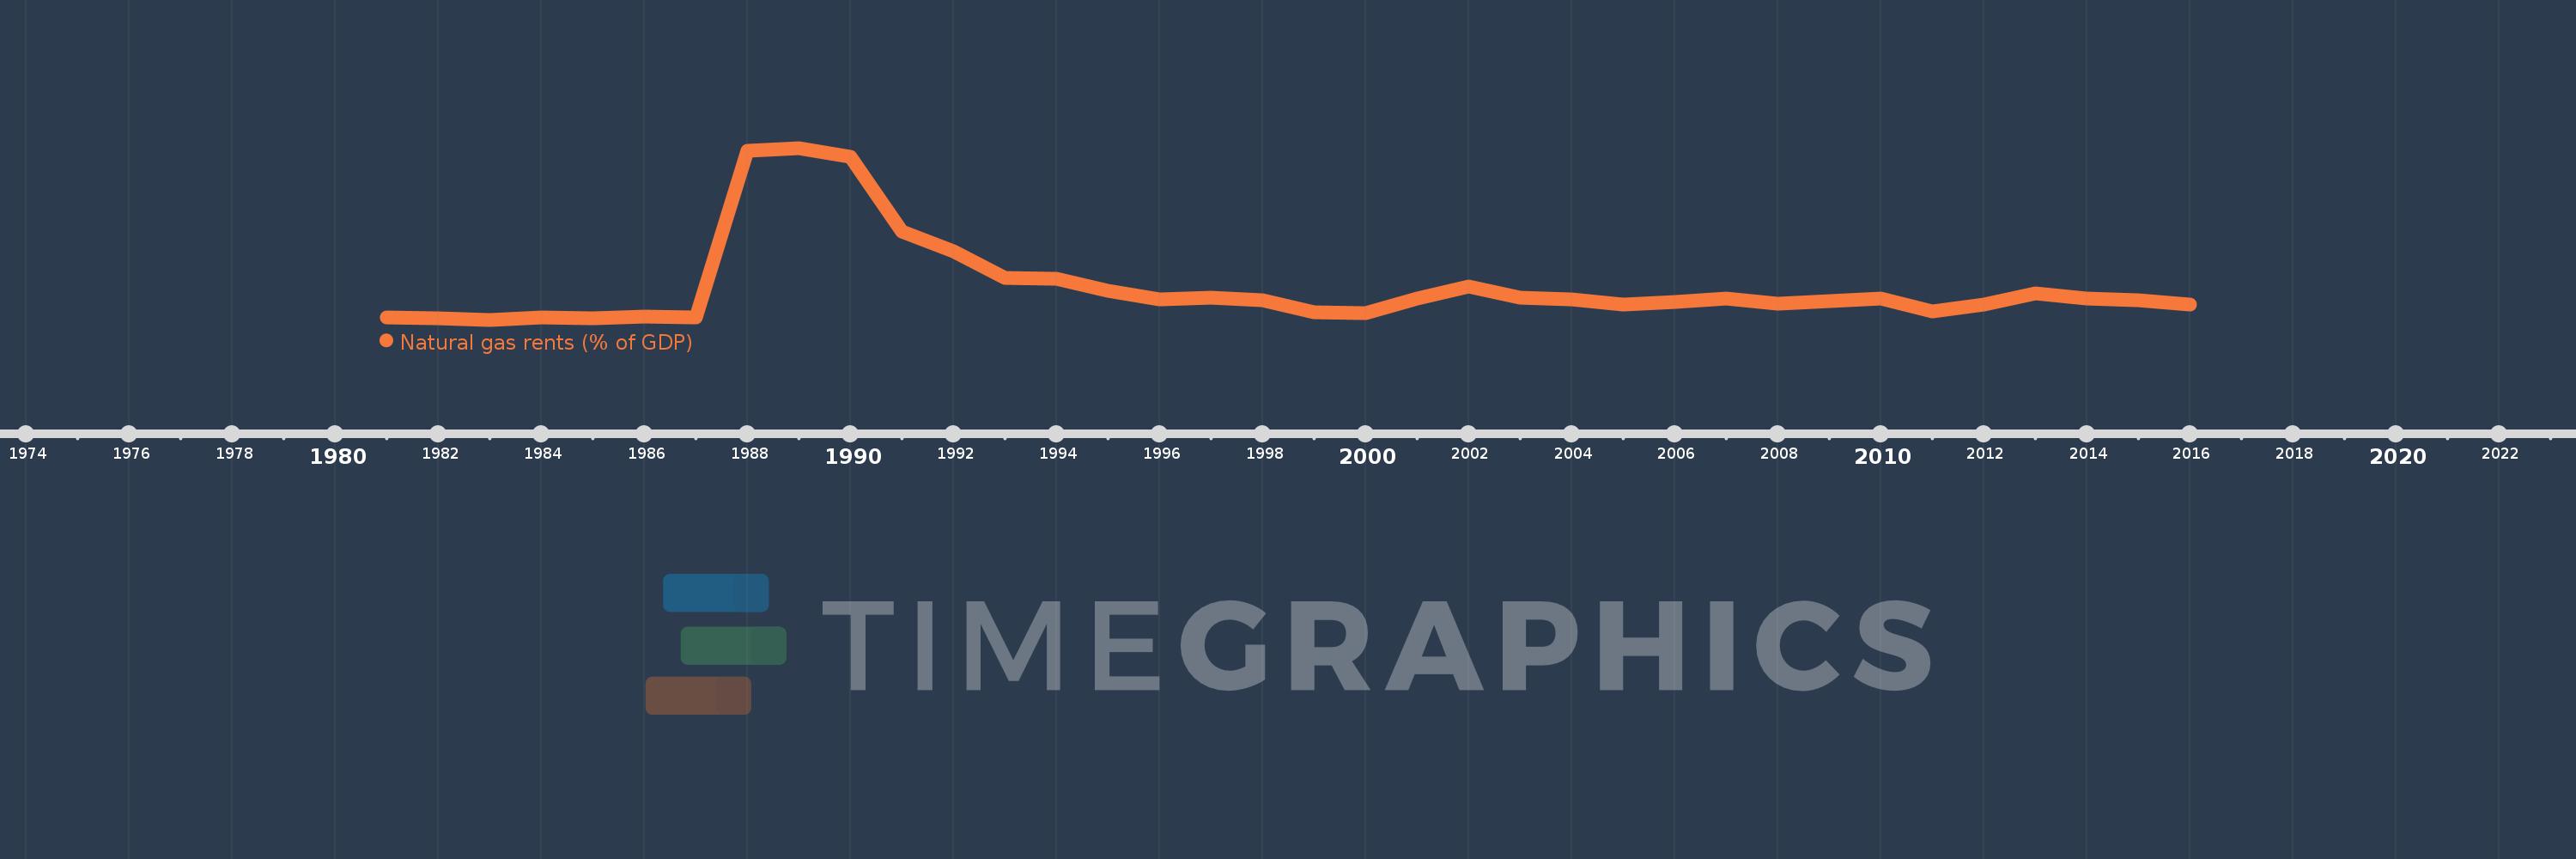
Natural gas rents (% of GDP)
2016,2015,2014,2013,2012,2011,2010,2009,2008,2007,2006,2005,2004,2003,2002,2001,2000,1999,1998,1997,1996,1995,1994,1993,1992,1991,1990,1989,1988,1987,1986,1985,1984,1983,1982,1981
Estas estatísticas em outros países:
Linha do tempo:
Nesta escala de tempo está apresentado um gráfico de 1981 ano até 2016 ano Central Europe and the Baltics. Dados de 1980 ano ausente. O número de observações reais por data: 36.
Fonte (nome):
Indicadores de desenvolvimento mundial
Fonte (organização):
Estimates based on sources and methods described in "The Changing Wealth of Nations: Measuring Sustainable Development in the New Millennium" (World Bank, 2011).
Categorias:
Energy & Mining, Environment
Foi atualizado:
23 abr 2017 ano
Indicadores de alterações dos valores ao longo dos anos
Mínimo:
0.005
1 jan 1983 ano
Máximo:
1.251
1 jan 1989 ano
Na data de observação
Valor
Mudança absoluta
A alteração em relação ao valor anterior
1 jan 1981 ano
0.024
+0.024
0.0%
1 jan 1982 ano
0.015
-0.009
-39.05%
1 jan 1983 ano
0.005
-0.01
-69.08%
1 jan 1984 ano
0.019
+0.014
315.74%
1 jan 1985 ano
0.018
-0.001
-5.25%
1 jan 1986 ano
0.026
+0.008
44.1%
1 jan 1987 ano
0.021
-0.005
-19.79%
1 jan 1988 ano
1.229
+1.209
5.84 mil%
1 jan 1989 ano
1.251
+0.021
1.71%
1 jan 1990 ano
1.186
-0.064
-5.13%
1 jan 1991 ano
0.646
-0.54
-45.54%
1 jan 1992 ano
0.502
-0.145
-22.38%
1 jan 1993 ano
0.309
-0.193
-38.41%
1 jan 1994 ano
0.303
-0.006
-2.06%
1 jan 1995 ano
0.218
-0.085
-27.95%
1 jan 1996 ano
0.153
-0.065
-29.79%
1 jan 1997 ano
0.162
+0.009
5.59%
1 jan 1998 ano
0.146
-0.016
-9.9%
1 jan 1999 ano
0.062
-0.084
-57.65%
1 jan 2000 ano
0.052
-0.009
-15.24%
1 jan 2001 ano
0.157
+0.105
200.39%
1 jan 2002 ano
0.247
+0.09
57.5%
1 jan 2003 ano
0.163
-0.084
-33.93%
1 jan 2004 ano
0.152
-0.011
-6.97%
1 jan 2005 ano
0.115
-0.037
-24.44%
1 jan 2006 ano
0.133
+0.018
16.07%
1 jan 2007 ano
0.161
+0.028
21.14%
1 jan 2008 ano
0.122
-0.04
-24.72%
1 jan 2009 ano
0.143
+0.021
17.28%
1 jan 2010 ano
0.161
+0.018
12.75%
1 jan 2011 ano
0.068
-0.092
-57.39%
1 jan 2012 ano
0.118
+0.05
72.86%
1 jan 2013 ano
0.197
+0.079
66.47%
1 jan 2014 ano
0.158
-0.039
-19.74%
1 jan 2015 ano
0.148
-0.01
-6.26%
1 jan 2016 ano
0.115
-0.034
-22.78%
Classificação de países por estatísticas atuais por anos


Comentários: