29
/pt/
pt
AIzaSyAYiBZKx7MnpbEhh9jyipgxe19OcubqV5w
April 1, 2024
259905
Tajikistan
TJK
true
2
1
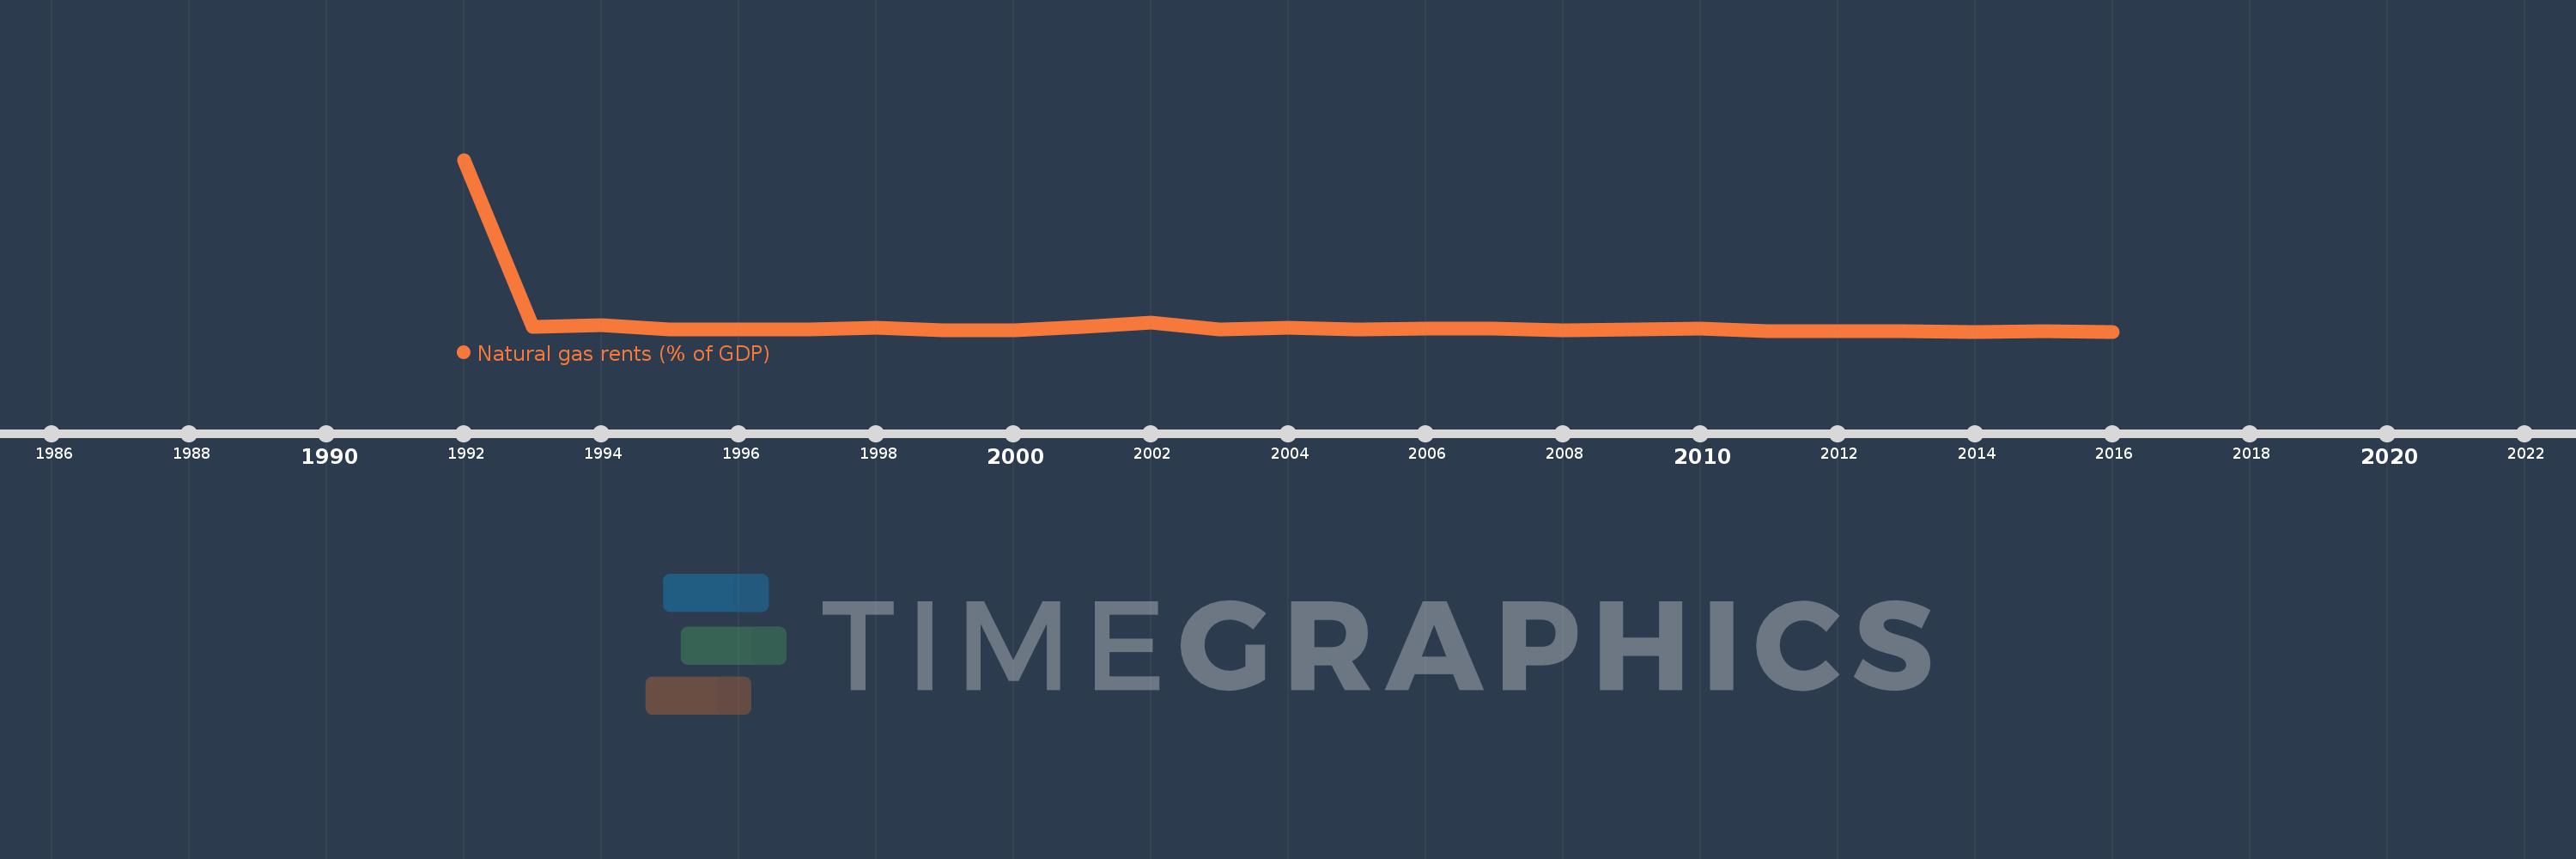
Natural gas rents (% of GDP)
2016,2015,2014,2013,2012,2011,2010,2009,2008,2007,2006,2005,2004,2003,2002,2001,2000,1999,1998,1997,1996,1995,1994,1993,1992
Estas estatísticas em outros países:
Linha do tempo:
Nesta escala de tempo está apresentado um gráfico de 1992 ano até 2016 ano Tajikistan. Dados de 1991 ano ausente. O número de observações reais por data: 25.
Fonte (nome):
Indicadores de desenvolvimento mundial
Fonte (organização):
Estimates based on sources and methods described in "The Changing Wealth of Nations: Measuring Sustainable Development in the New Millennium" (World Bank, 2011).
Categorias:
Energy & Mining, Environment
Foi atualizado:
23 abr 2017 ano
Indicadores de alterações dos valores ao longo dos anos
Mínimo:
0.017
1 jan 2014 ano
Máximo:
3.622
1 jan 1992 ano
Na data de observação
Valor
Mudança absoluta
A alteração em relação ao valor anterior
1 jan 1992 ano
3.622
+3.622
0.0%
1 jan 1993 ano
0.114
-3.508
-96.86%
1 jan 1994 ano
0.152
+0.039
33.93%
1 jan 1995 ano
0.055
-0.097
-63.89%
1 jan 1996 ano
0.07
+0.015
27.7%
1 jan 1997 ano
0.07
+0.0
0.03%
1 jan 1998 ano
0.092
+0.022
30.83%
1 jan 1999 ano
0.047
-0.045
-48.46%
1 jan 2000 ano
0.049
+0.001
2.69%
1 jan 2001 ano
0.122
+0.074
151.68%
1 jan 2002 ano
0.212
+0.09
73.52%
1 jan 2003 ano
0.057
-0.155
-73.13%
1 jan 2004 ano
0.099
+0.042
73.98%
1 jan 2005 ano
0.065
-0.034
-34.53%
1 jan 2006 ano
0.083
+0.018
27.85%
1 jan 2007 ano
0.089
+0.006
6.79%
1 jan 2008 ano
0.037
-0.052
-58.65%
1 jan 2009 ano
0.059
+0.022
59.39%
1 jan 2010 ano
0.075
+0.016
28.16%
1 jan 2011 ano
0.03
-0.045
-59.45%
1 jan 2012 ano
0.023
-0.007
-23.52%
1 jan 2013 ano
0.024
+0.001
2.37%
1 jan 2014 ano
0.017
-0.007
-29.03%
1 jan 2015 ano
0.023
+0.006
36.53%
1 jan 2016 ano
0.017
-0.006
-25.3%
Classificação de países por estatísticas atuais por anos


Comentários: