29
/it/
it
AIzaSyAYiBZKx7MnpbEhh9jyipgxe19OcubqV5w
April 1, 2024
259905
Tajikistan
TJK
true
2
1
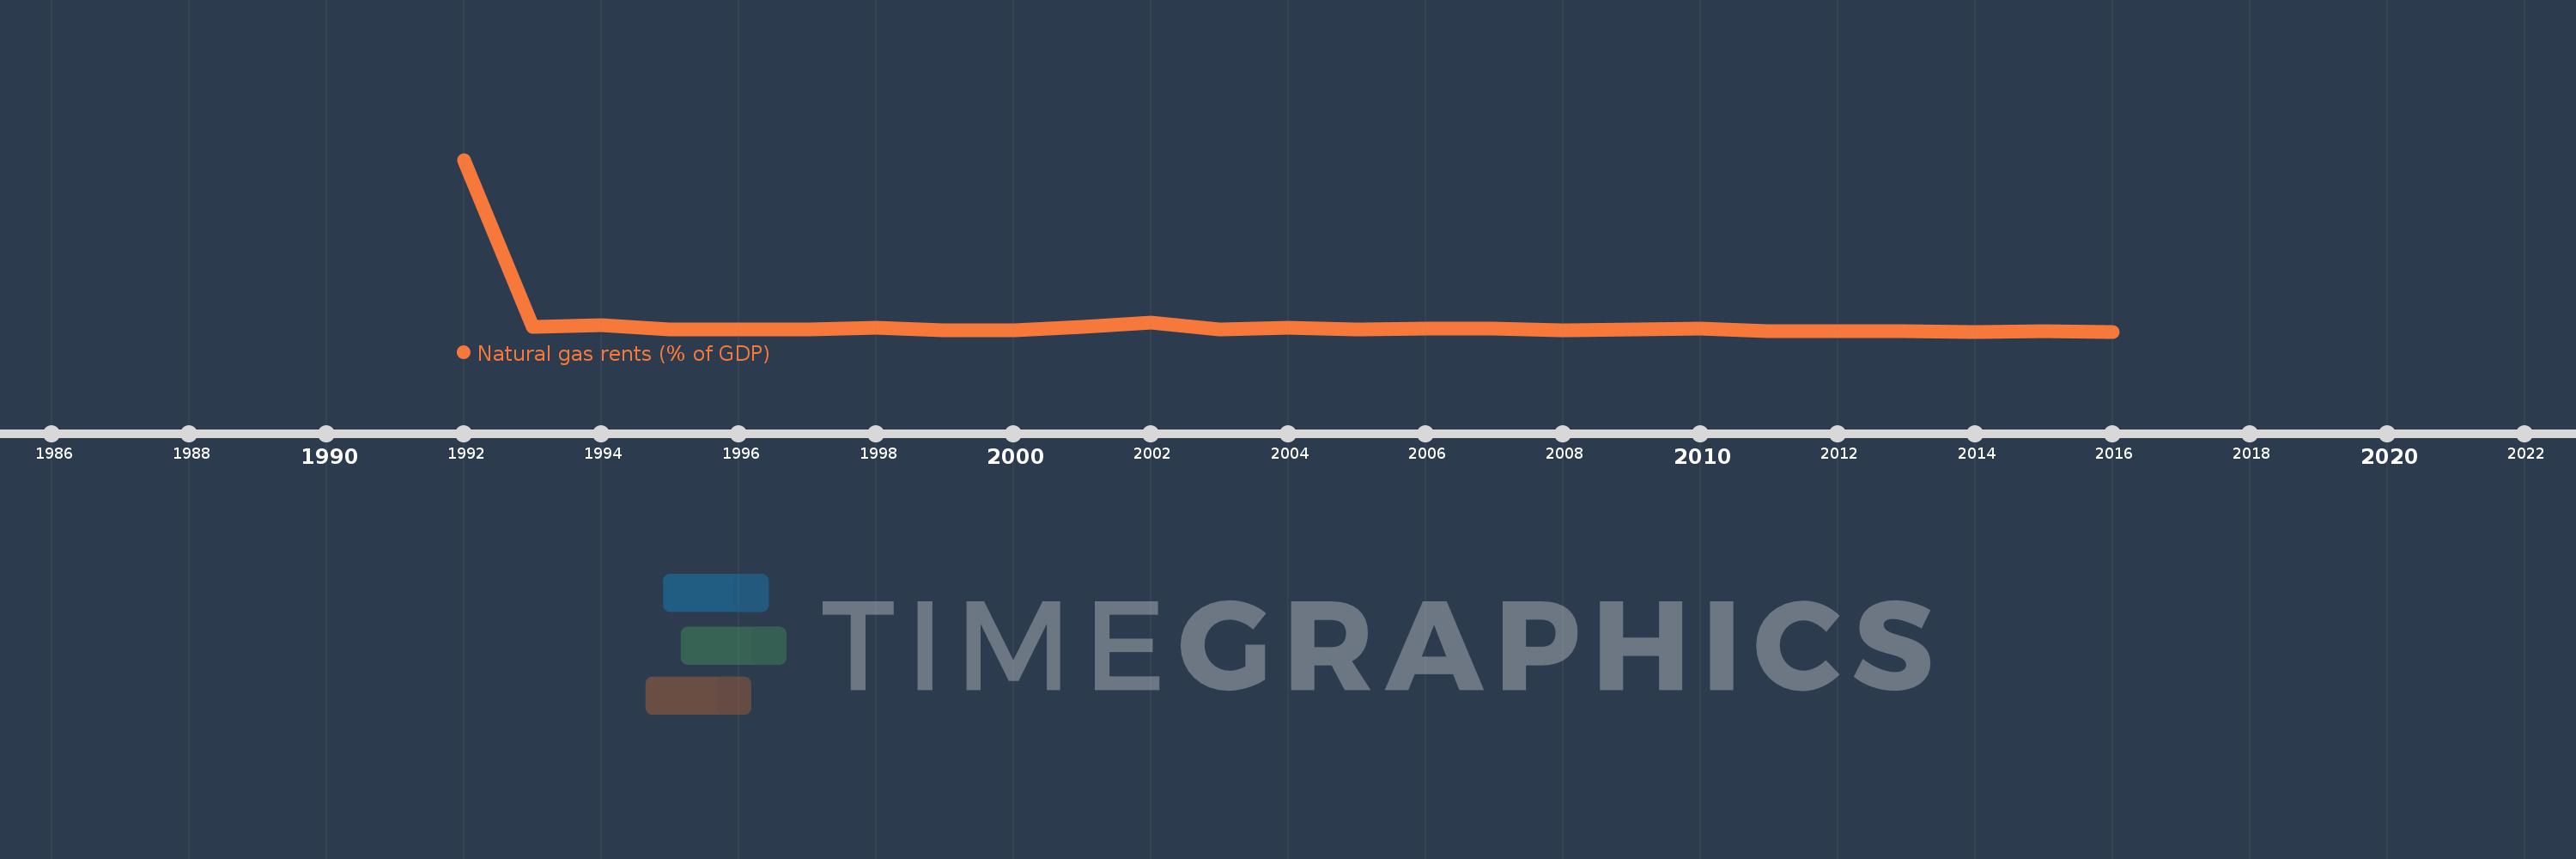
Natural gas rents (% of GDP)
2016,2015,2014,2013,2012,2011,2010,2009,2008,2007,2006,2005,2004,2003,2002,2001,2000,1999,1998,1997,1996,1995,1994,1993,1992
Queste statistiche in altri paesi:
Linea del tempo:
Questa scala temporale mostra un grafico dal 1992 anno al 2016 anno. Tajikistan. I dati fino ad 1991 anno non disponibili. Il numero di osservazioni attuali secondo i date: 25.
La fonte (nome):
Indicatori dello sviluppo mondiale
La fonte (organizzazione):
Estimates based on sources and methods described in "The Changing Wealth of Nations: Measuring Sustainable Development in the New Millennium" (World Bank, 2011).
Categorie:
Energy & Mining, Environment
sono stati aggiornati
23 apr 2017 anni
Indicatori delle variazioni dei valori per anni
Minima:
0.017
1 gen 2014 anni
Massimo:
3.622
1 gen 1992 anni
Alla data di osservazione
Valore
Variazione assoluta
La variazione rispetto al valore precedente
1 gen 1992 anni
3.622
+3.622
0.0%
1 gen 1993 anni
0.114
-3.508
-96.86%
1 gen 1994 anni
0.152
+0.039
33.93%
1 gen 1995 anni
0.055
-0.097
-63.89%
1 gen 1996 anni
0.07
+0.015
27.7%
1 gen 1997 anni
0.07
+0.0
0.03%
1 gen 1998 anni
0.092
+0.022
30.83%
1 gen 1999 anni
0.047
-0.045
-48.46%
1 gen 2000 anni
0.049
+0.001
2.69%
1 gen 2001 anni
0.122
+0.074
151.68%
1 gen 2002 anni
0.212
+0.09
73.52%
1 gen 2003 anni
0.057
-0.155
-73.13%
1 gen 2004 anni
0.099
+0.042
73.98%
1 gen 2005 anni
0.065
-0.034
-34.53%
1 gen 2006 anni
0.083
+0.018
27.85%
1 gen 2007 anni
0.089
+0.006
6.79%
1 gen 2008 anni
0.037
-0.052
-58.65%
1 gen 2009 anni
0.059
+0.022
59.39%
1 gen 2010 anni
0.075
+0.016
28.16%
1 gen 2011 anni
0.03
-0.045
-59.45%
1 gen 2012 anni
0.023
-0.007
-23.52%
1 gen 2013 anni
0.024
+0.001
2.37%
1 gen 2014 anni
0.017
-0.007
-29.03%
1 gen 2015 anni
0.023
+0.006
36.53%
1 gen 2016 anni
0.017
-0.006
-25.3%
Classificazione dei paesi secondo i statistiche attuali per anni


Commenti: