29
/it/
it
AIzaSyAYiBZKx7MnpbEhh9jyipgxe19OcubqV5w
April 1, 2024
276930
United States
USA
true
2
1
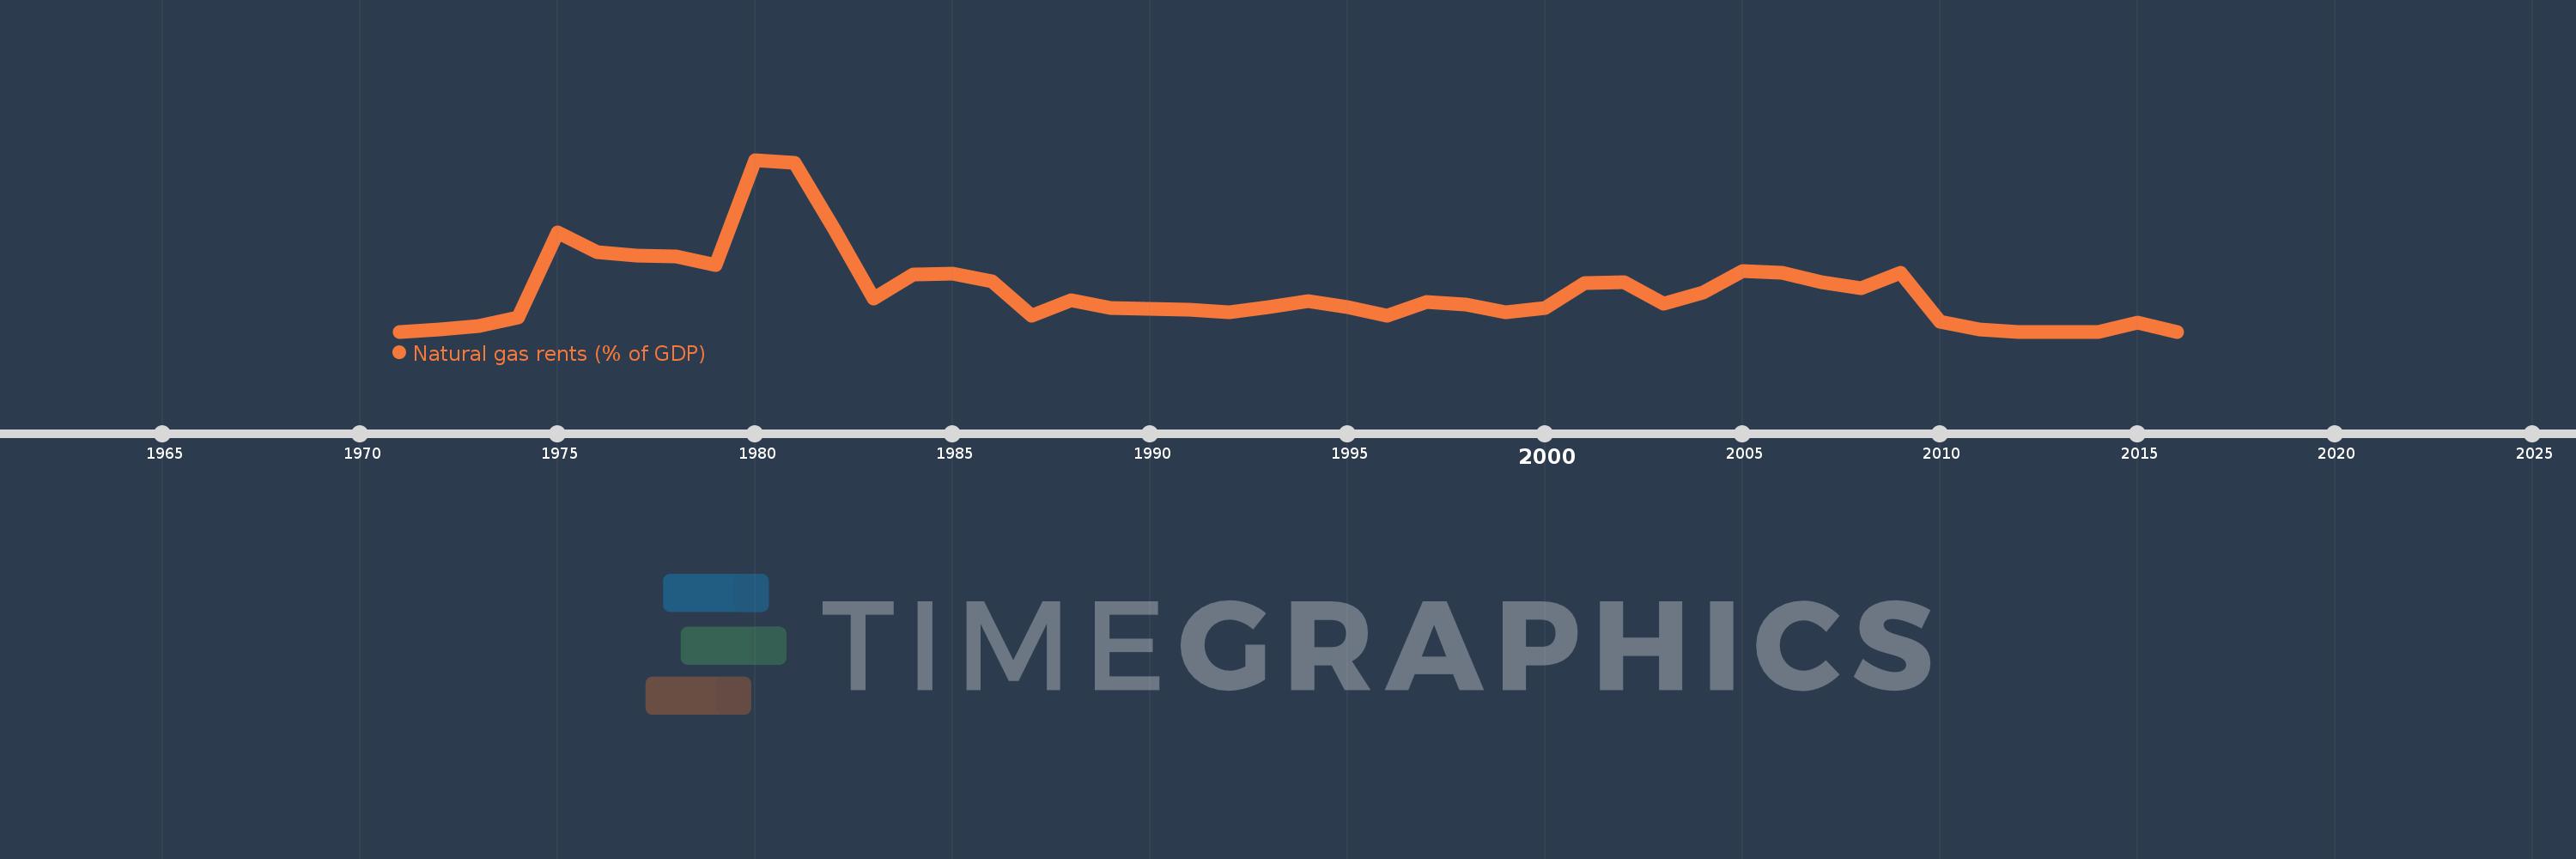
Natural gas rents (% of GDP)
2016,2015,2014,2013,2012,2011,2010,2009,2008,2007,2006,2005,2004,2003,2002,2001,2000,1999,1998,1997,1996,1995,1994,1993,1992,1991,1990,1989,1988,1987,1986,1985,1984,1983,1982,1981,1980,1979,1978,1977,1976,1975,1974,1973,1972,1971
Queste statistiche in altri paesi:
Linea del tempo:
Questa scala temporale mostra un grafico dal 1971 anno al 2016 anno. United States. I dati fino ad 1970 anno non disponibili. Il numero di osservazioni attuali secondo i date: 46.
La fonte (nome):
Indicatori dello sviluppo mondiale
La fonte (organizzazione):
Estimates based on sources and methods described in "The Changing Wealth of Nations: Measuring Sustainable Development in the New Millennium" (World Bank, 2011).
Categorie:
Energy & Mining, Environment
sono stati aggiornati
23 apr 2017 anni
Indicatori delle variazioni dei valori per anni
Minima:
0.0
1 gen 1971 anni
Massimo:
1.941
1 gen 1980 anni
Alla data di osservazione
Valore
Variazione assoluta
La variazione rispetto al valore precedente
1 gen 1971 anni
0.0
0.0
0.0%
1 gen 1972 anni
0.02
+0.02
%
1 gen 1973 anni
0.064
+0.044
218.39%
1 gen 1974 anni
0.156
+0.092
143.59%
1 gen 1975 anni
1.125
+0.969
619.31%
1 gen 1976 anni
0.899
-0.226
-20.06%
1 gen 1977 anni
0.862
-0.037
-4.14%
1 gen 1978 anni
0.852
-0.011
-1.22%
1 gen 1979 anni
0.753
-0.099
-11.59%
1 gen 1980 anni
1.941
+1.188
157.76%
1 gen 1981 anni
1.91
-0.031
-1.6%
1 gen 1982 anni
1.162
-0.748
-39.17%
1 gen 1983 anni
0.369
-0.793
-68.27%
1 gen 1984 anni
0.645
+0.276
74.88%
1 gen 1985 anni
0.659
+0.014
2.23%
1 gen 1986 anni
0.566
-0.093
-14.18%
1 gen 1987 anni
0.183
-0.383
-67.72%
1 gen 1988 anni
0.359
+0.177
96.9%
1 gen 1989 anni
0.271
-0.088
-24.59%
1 gen 1990 anni
0.258
-0.013
-4.84%
1 gen 1991 anni
0.248
-0.01
-3.87%
1 gen 1992 anni
0.215
-0.033
-13.16%
1 gen 1993 anni
0.273
+0.058
26.84%
1 gen 1994 anni
0.348
+0.075
27.53%
1 gen 1995 anni
0.278
-0.07
-20.06%
1 gen 1996 anni
0.184
-0.094
-33.85%
1 gen 1997 anni
0.339
+0.155
84.05%
1 gen 1998 anni
0.301
-0.038
-11.08%
1 gen 1999 anni
0.219
-0.082
-27.23%
1 gen 2000 anni
0.27
+0.05
23.02%
1 gen 2001 anni
0.547
+0.277
102.66%
1 gen 2002 anni
0.56
+0.013
2.33%
1 gen 2003 anni
0.316
-0.243
-43.49%
1 gen 2004 anni
0.444
+0.128
40.48%
1 gen 2005 anni
0.687
+0.243
54.59%
1 gen 2006 anni
0.669
-0.018
-2.66%
1 gen 2007 anni
0.556
-0.112
-16.82%
1 gen 2008 anni
0.49
-0.066
-11.83%
1 gen 2009 anni
0.663
+0.173
35.3%
1 gen 2010 anni
0.109
-0.555
-83.63%
1 gen 2011 anni
0.024
-0.084
-77.55%
1 gen 2012 anni
0.0
-0.024
-100.0%
1 gen 2015 anni
0.1
+0.1
%
1 gen 2016 anni
0.0
-0.1
-100.0%
Classificazione dei paesi secondo i statistiche attuali per anni


Commenti: