29
/it/
it
AIzaSyAYiBZKx7MnpbEhh9jyipgxe19OcubqV5w
April 1, 2024
127585
Equatorial Guinea
GNQ
true
2
1
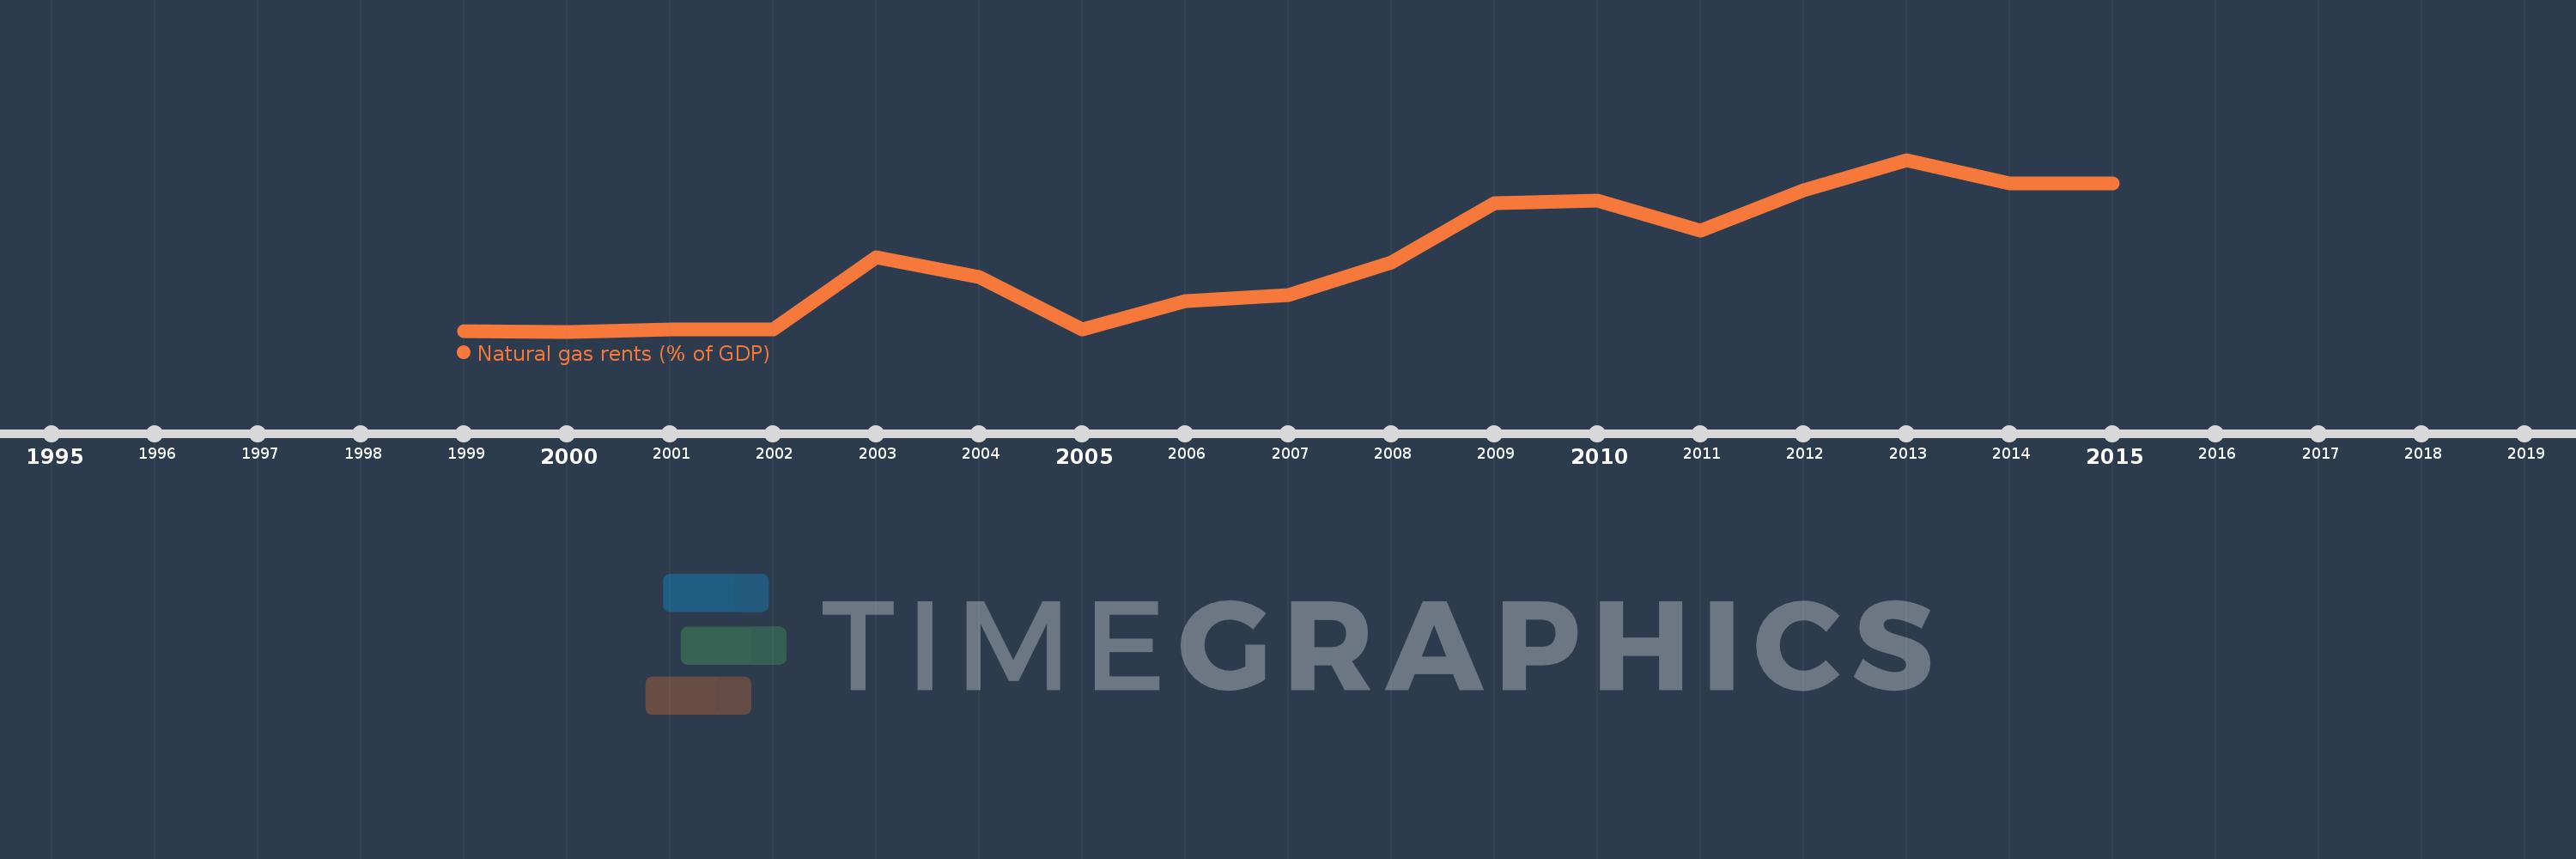
Natural gas rents (% of GDP)
2015,2014,2013,2012,2011,2010,2009,2008,2007,2006,2005,2004,2003,2002,2001,2000,1999
Queste statistiche in altri paesi:
Linea del tempo:
Questa scala temporale mostra un grafico dal 1999 anno al 2015 anno. Equatorial Guinea. I dati fino ad 1998 anno non disponibili. Il numero di osservazioni attuali secondo i date: 17.
La fonte (nome):
Indicatori dello sviluppo mondiale
La fonte (organizzazione):
Estimates based on sources and methods described in "The Changing Wealth of Nations: Measuring Sustainable Development in the New Millennium" (World Bank, 2011).
Categorie:
Energy & Mining, Environment
sono stati aggiornati
23 apr 2017 anni
Indicatori delle variazioni dei valori per anni
Minima:
0.012
1 gen 2000 anni
Massimo:
1.996
1 gen 2013 anni
Alla data di osservazione
Valore
Variazione assoluta
La variazione rispetto al valore precedente
1 gen 1999 anni
0.019
+0.019
0.0%
1 gen 2000 anni
0.012
-0.007
-39.29%
1 gen 2001 anni
0.035
+0.023
201.7%
1 gen 2002 anni
0.032
-0.003
-9.02%
1 gen 2003 anni
0.87
+0.838
2.64 Mille.%
1 gen 2004 anni
0.64
-0.231
-26.5%
1 gen 2005 anni
0.033
-0.606
-94.82%
1 gen 2006 anni
0.361
+0.328
991.81%
1 gen 2007 anni
0.436
+0.075
20.74%
1 gen 2008 anni
0.815
+0.379
86.89%
1 gen 2009 anni
1.5
+0.684
83.91%
1 gen 2010 anni
1.525
+0.025
1.67%
1 gen 2011 anni
1.18
-0.345
-22.6%
1 gen 2012 anni
1.64
+0.46
38.98%
1 gen 2013 anni
1.996
+0.356
21.71%
1 gen 2014 anni
1.726
-0.27
-13.54%
1 gen 2015 anni
1.728
+0.003
0.15%
Classificazione dei paesi secondo i statistiche attuali per anni


Commenti: