29
/pt/
pt
AIzaSyAYiBZKx7MnpbEhh9jyipgxe19OcubqV5w
April 1, 2024
134207
France
FRA
true
2
1
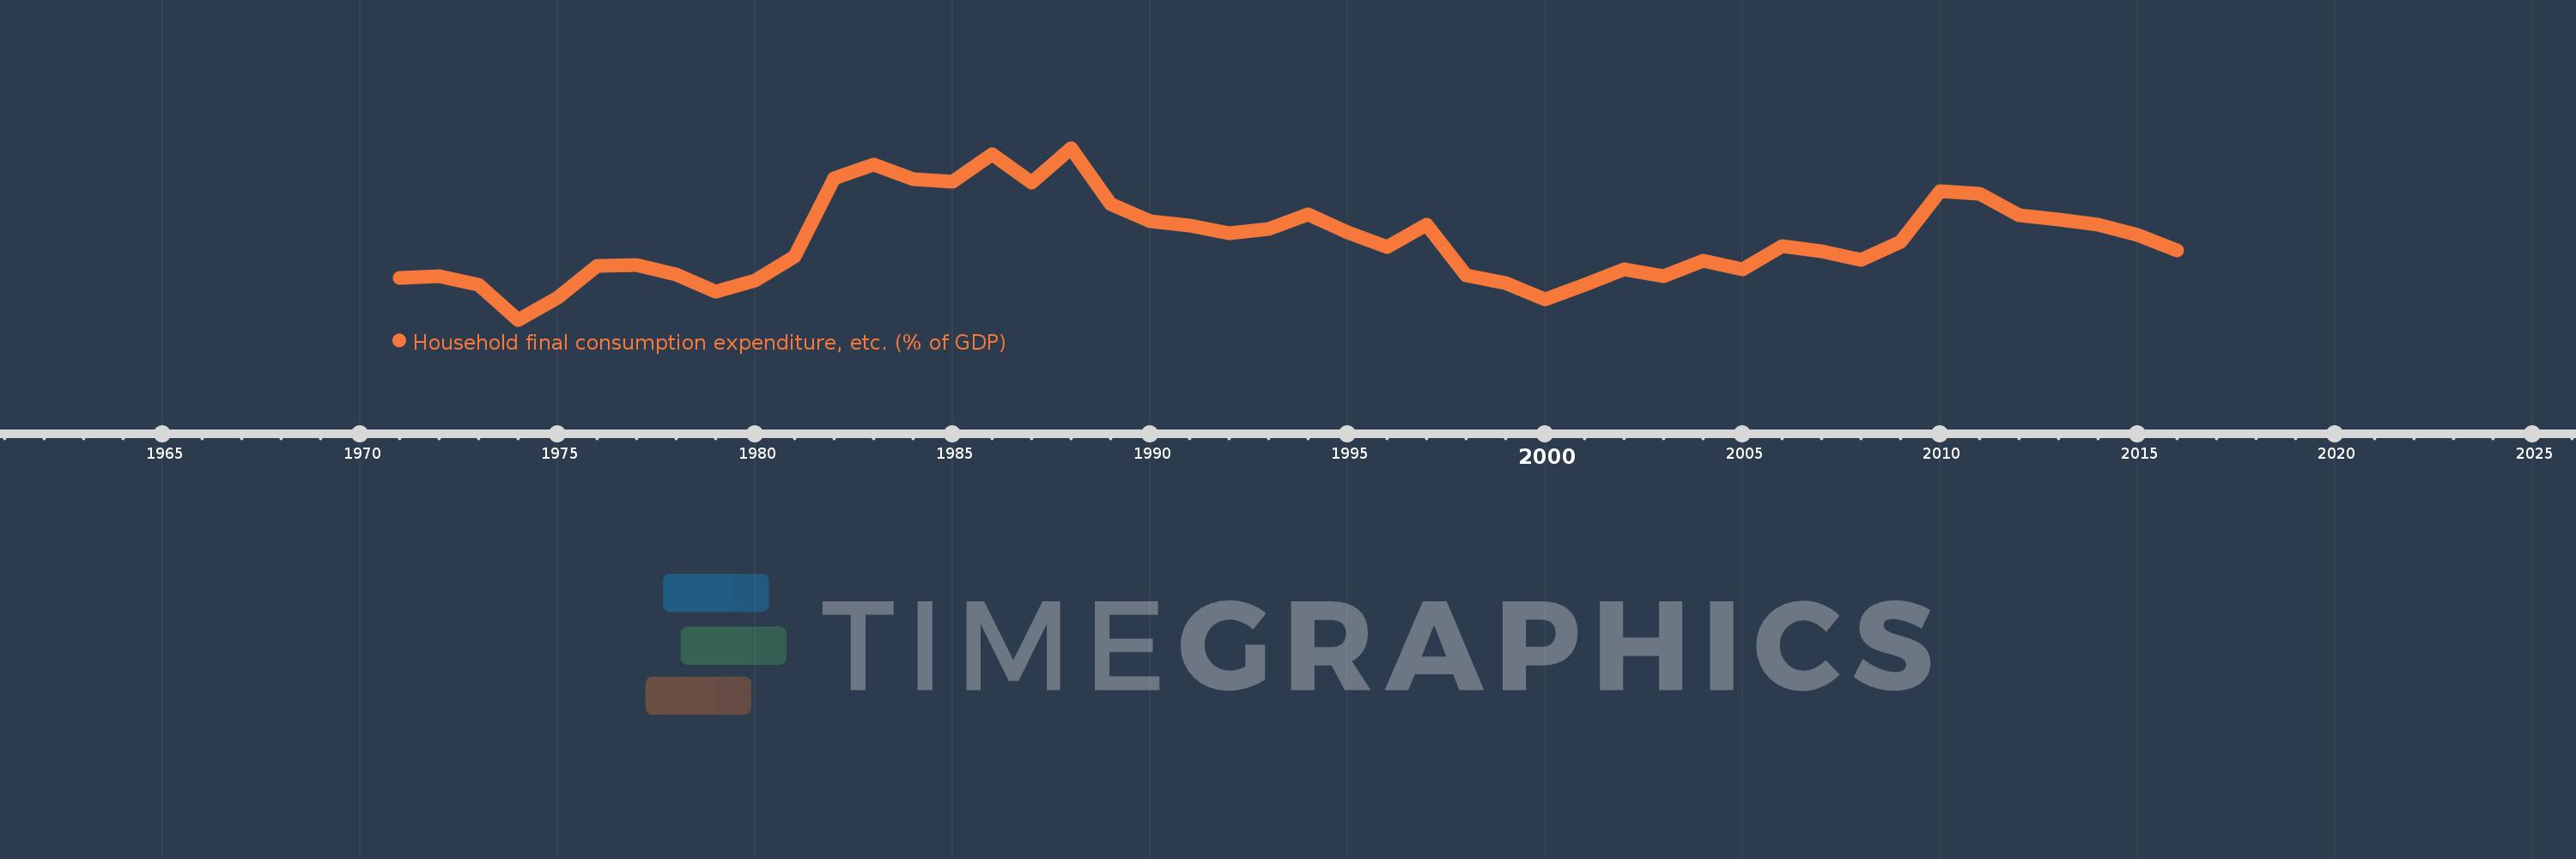
Household final consumption expenditure, etc. (% of GDP)
2016,2015,2014,2013,2012,2011,2010,2009,2008,2007,2006,2005,2004,2003,2002,2001,2000,1999,1998,1997,1996,1995,1994,1993,1992,1991,1990,1989,1988,1987,1986,1985,1984,1983,1982,1981,1980,1979,1978,1977,1976,1975,1974,1973,1972,1971
Estas estatísticas em outros países:
AfghanistanAlbaniaAlgeriaAngolaAntigua and BarbudaArab WorldArgentinaArmeniaArubaAustraliaAustriaAzerbaijanBahamas, TheBahrainBangladeshBarbadosBelarusBelgiumBelizeBeninBermudaBhutanBoliviaBosnia and HerzegovinaBotswanaBrazilBrunei DarussalamBulgariaBurkina FasoBurundiCabo VerdeCambodiaCameroonCanadaCaribbean small statesCentral African RepublicCentral Europe and the BalticsChadChileChinaColombiaComorosCongo, Dem. Rep.Congo, Rep.Costa RicaCote d'IvoireCroatiaCubaCyprusCzech RepublicDenmarkDjiboutiDominicaDominican RepublicEarly-demographic dividendEast Asia & PacificEast Asia & Pacific (excluding high income)East Asia & Pacific (IDA & IBRD countries)EcuadorEgypt, Arab Rep.El SalvadorEquatorial GuineaEritreaEstoniaEthiopiaEuro areaEurope & Central AsiaEurope & Central Asia (excluding high income)Europe & Central Asia (IDA & IBRD countries)European UnionFaroe IslandsFijiFinlandFragile and conflict affected situationsFranceGabonGambia, TheGeorgiaGermanyGhanaGreeceGrenadaGuatemalaGuineaGuinea-BissauGuyanaHaitiHeavily indebted poor countries (HIPC)High incomeHondurasHong Kong SAR, ChinaHungaryIBRD onlyIcelandIDA & IBRD totalIDA blendIDA onlyIDA totalIndiaIndonesiaIran, Islamic Rep.IraqIrelandIsraelItalyJamaicaJapanJordanKazakhstanKenyaKiribatiKorea, Rep.KosovoKuwaitKyrgyz RepublicLao PDRLate-demographic dividendLatin America & Caribbean Latin America & Caribbean (excluding high income)Latin America & the Caribbean (IDA & IBRD countries)LatviaLeast developed countries: UN classificationLebanonLesothoLiberiaLibyaLithuaniaLow & middle incomeLow incomeLower middle incomeLuxembourgMacao SAR, ChinaMacedonia, FYRMadagascarMalawiMalaysiaMaldivesMaliMaltaMauritaniaMauritiusMexicoMicronesia, Fed. Sts.Middle East & North AfricaMiddle East & North Africa (excluding high income)Middle East & North Africa (IDA & IBRD countries)Middle incomeMoldovaMongoliaMontenegroMoroccoMozambiqueNamibiaNepalNetherlandsNew CaledoniaNew ZealandNicaraguaNigerNigeriaNorth AmericaNorwayOECD membersOmanOther small statesPacific island small statesPakistanPanamaPapua New GuineaParaguayPeruPhilippinesPolandPortugalPost-demographic dividendPre-demographic dividendPuerto RicoQatarRomaniaRussian FederationRwandaSaudi ArabiaSenegalSerbiaSeychellesSierra LeoneSingaporeSlovak RepublicSloveniaSmall statesSolomon IslandsSomaliaSouth AfricaSouth AsiaSouth Asia (IDA & IBRD)South SudanSpainSri LankaSt. Kitts and NevisSt. LuciaSt. Vincent and the GrenadinesSub-Saharan Africa Sub-Saharan Africa (excluding high income)Sub-Saharan Africa (IDA & IBRD countries)SudanSurinameSwazilandSwedenSwitzerlandSyrian Arab RepublicTajikistanTanzaniaThailandTimor-LesteTogoTongaTrinidad and TobagoTunisiaTurkeyTurkmenistanUgandaUkraineUnited Arab EmiratesUnited KingdomUnited StatesUpper middle incomeUruguayUzbekistanVanuatuVenezuela, RBVietnamWest Bank and GazaWorldYemen, Rep.ZambiaZimbabwe Linha do tempo:
Nesta escala de tempo está apresentado um gráfico de 1971 ano até 2016 ano France. Dados de 1970 ano ausente. O número de observações reais por data: 46.
Fonte (nome):
Indicadores de desenvolvimento mundial
Fonte (organização):
World Bank national accounts data, and OECD National Accounts data files.
Categorias:
Economy & Growth
Foi atualizado:
23 abr 2017 ano
Indicadores de alterações dos valores ao longo dos anos
Mínimo:
53.793
1 jan 1974 ano
Máximo:
57.007
1 jan 1988 ano
Na data de observação
Valor
Mudança absoluta
A alteração em relação ao valor anterior
1 jan 1971 ano
54.579
+54.579
0.0%
1 jan 1972 ano
54.605
+0.026
0.05%
1 jan 1973 ano
54.455
-0.15
-0.27%
1 jan 1974 ano
53.793
-0.662
-1.22%
1 jan 1975 ano
54.203
+0.411
0.76%
1 jan 1976 ano
54.794
+0.59
1.09%
1 jan 1977 ano
54.818
+0.024
0.04%
1 jan 1978 ano
54.643
-0.174
-0.32%
1 jan 1979 ano
54.322
-0.321
-0.59%
1 jan 1980 ano
54.522
+0.2
0.37%
1 jan 1981 ano
54.982
+0.46
0.84%
1 jan 1982 ano
56.444
+1.462
2.66%
1 jan 1983 ano
56.697
+0.253
0.45%
1 jan 1984 ano
56.416
-0.281
-0.5%
1 jan 1985 ano
56.372
-0.043
-0.08%
1 jan 1986 ano
56.895
+0.522
0.93%
1 jan 1987 ano
56.355
-0.54
-0.95%
1 jan 1988 ano
57.007
+0.653
1.16%
1 jan 1989 ano
55.957
-1.05
-1.84%
1 jan 1990 ano
55.629
-0.328
-0.59%
1 jan 1991 ano
55.555
-0.074
-0.13%
1 jan 1992 ano
55.415
-0.139
-0.25%
1 jan 1993 ano
55.497
+0.081
0.15%
1 jan 1994 ano
55.77
+0.274
0.49%
1 jan 1995 ano
55.426
-0.344
-0.62%
1 jan 1996 ano
55.159
-0.267
-0.48%
1 jan 1997 ano
55.579
+0.419
0.76%
1 jan 1998 ano
54.622
-0.957
-1.72%
1 jan 1999 ano
54.487
-0.135
-0.25%
1 jan 2000 ano
54.173
-0.314
-0.58%
1 jan 2001 ano
54.443
+0.269
0.5%
1 jan 2002 ano
54.736
+0.294
0.54%
1 jan 2003 ano
54.603
-0.133
-0.24%
1 jan 2004 ano
54.89
+0.286
0.52%
1 jan 2005 ano
54.741
-0.149
-0.27%
1 jan 2006 ano
55.168
+0.427
0.78%
1 jan 2007 ano
55.081
-0.087
-0.16%
1 jan 2008 ano
54.912
-0.169
-0.31%
1 jan 2009 ano
55.254
+0.342
0.62%
1 jan 2010 ano
56.194
+0.94
1.7%
1 jan 2011 ano
56.143
-0.05
-0.09%
1 jan 2012 ano
55.744
-0.399
-0.71%
1 jan 2013 ano
55.667
-0.077
-0.14%
1 jan 2014 ano
55.577
-0.09
-0.16%
1 jan 2015 ano
55.382
-0.195
-0.35%
1 jan 2016 ano
55.09
-0.293
-0.53%
Classificação de países por estatísticas atuais por anos


Comentários: