29
/pt/
pt
AIzaSyAYiBZKx7MnpbEhh9jyipgxe19OcubqV5w
April 1, 2024
29155
East Asia & Pacific (IDA & IBRD countries)
TEA
false
2
1
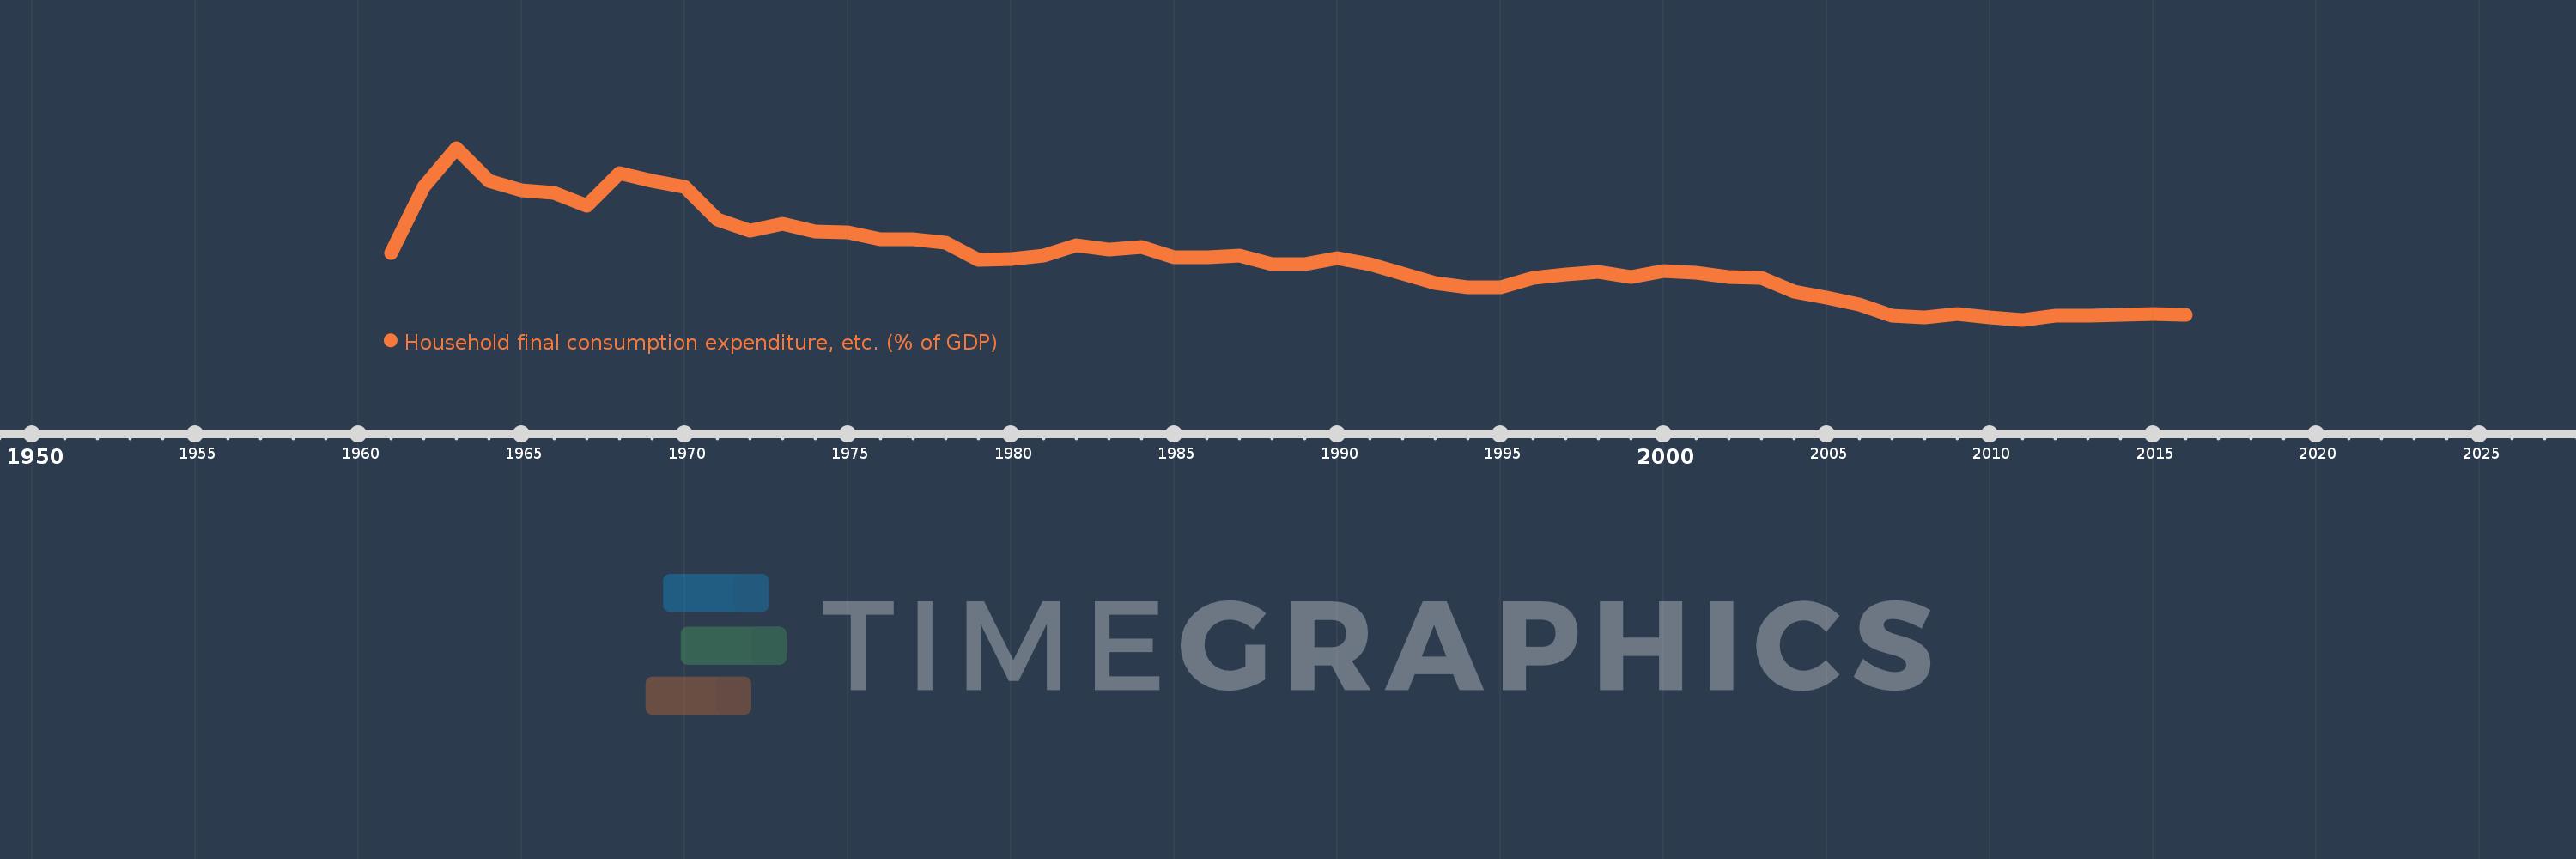
Household final consumption expenditure, etc. (% of GDP)
2016,2015,2014,2013,2012,2011,2010,2009,2008,2007,2006,2005,2004,2003,2002,2001,2000,1999,1998,1997,1996,1995,1994,1993,1992,1991,1990,1989,1988,1987,1986,1985,1984,1983,1982,1981,1980,1979,1978,1977,1976,1975,1974,1973,1972,1971,1970,1969,1968,1967,1966,1965,1964,1963,1962,1961
Estas estatísticas em outros países:
AfghanistanAlbaniaAlgeriaAngolaAntigua and BarbudaArab WorldArgentinaArmeniaArubaAustraliaAustriaAzerbaijanBahamas, TheBahrainBangladeshBarbadosBelarusBelgiumBelizeBeninBermudaBhutanBoliviaBosnia and HerzegovinaBotswanaBrazilBrunei DarussalamBulgariaBurkina FasoBurundiCabo VerdeCambodiaCameroonCanadaCaribbean small statesCentral African RepublicCentral Europe and the BalticsChadChileChinaColombiaComorosCongo, Dem. Rep.Congo, Rep.Costa RicaCote d'IvoireCroatiaCubaCyprusCzech RepublicDenmarkDjiboutiDominicaDominican RepublicEarly-demographic dividendEast Asia & PacificEast Asia & Pacific (excluding high income)East Asia & Pacific (IDA & IBRD countries)EcuadorEgypt, Arab Rep.El SalvadorEquatorial GuineaEritreaEstoniaEthiopiaEuro areaEurope & Central AsiaEurope & Central Asia (excluding high income)Europe & Central Asia (IDA & IBRD countries)European UnionFaroe IslandsFijiFinlandFragile and conflict affected situationsFranceGabonGambia, TheGeorgiaGermanyGhanaGreeceGrenadaGuatemalaGuineaGuinea-BissauGuyanaHaitiHeavily indebted poor countries (HIPC)High incomeHondurasHong Kong SAR, ChinaHungaryIBRD onlyIcelandIDA & IBRD totalIDA blendIDA onlyIDA totalIndiaIndonesiaIran, Islamic Rep.IraqIrelandIsraelItalyJamaicaJapanJordanKazakhstanKenyaKiribatiKorea, Rep.KosovoKuwaitKyrgyz RepublicLao PDRLate-demographic dividendLatin America & Caribbean Latin America & Caribbean (excluding high income)Latin America & the Caribbean (IDA & IBRD countries)LatviaLeast developed countries: UN classificationLebanonLesothoLiberiaLibyaLithuaniaLow & middle incomeLow incomeLower middle incomeLuxembourgMacao SAR, ChinaMacedonia, FYRMadagascarMalawiMalaysiaMaldivesMaliMaltaMauritaniaMauritiusMexicoMicronesia, Fed. Sts.Middle East & North AfricaMiddle East & North Africa (excluding high income)Middle East & North Africa (IDA & IBRD countries)Middle incomeMoldovaMongoliaMontenegroMoroccoMozambiqueNamibiaNepalNetherlandsNew CaledoniaNew ZealandNicaraguaNigerNigeriaNorth AmericaNorwayOECD membersOmanOther small statesPacific island small statesPakistanPanamaPapua New GuineaParaguayPeruPhilippinesPolandPortugalPost-demographic dividendPre-demographic dividendPuerto RicoQatarRomaniaRussian FederationRwandaSaudi ArabiaSenegalSerbiaSeychellesSierra LeoneSingaporeSlovak RepublicSloveniaSmall statesSolomon IslandsSomaliaSouth AfricaSouth AsiaSouth Asia (IDA & IBRD)South SudanSpainSri LankaSt. Kitts and NevisSt. LuciaSt. Vincent and the GrenadinesSub-Saharan Africa Sub-Saharan Africa (excluding high income)Sub-Saharan Africa (IDA & IBRD countries)SudanSurinameSwazilandSwedenSwitzerlandSyrian Arab RepublicTajikistanTanzaniaThailandTimor-LesteTogoTongaTrinidad and TobagoTunisiaTurkeyTurkmenistanUgandaUkraineUnited Arab EmiratesUnited KingdomUnited StatesUpper middle incomeUruguayUzbekistanVanuatuVenezuela, RBVietnamWest Bank and GazaWorldYemen, Rep.ZambiaZimbabwe Linha do tempo:
Nesta escala de tempo está apresentado um gráfico de 1961 ano até 2016 ano East Asia & Pacific (IDA & IBRD countries). Dados de 1960 ano ausente. O número de observações reais por data: 56.
Fonte (nome):
Indicadores de desenvolvimento mundial
Fonte (organização):
World Bank national accounts data, and OECD National Accounts data files.
Categorias:
Economy & Growth
Foi atualizado:
23 abr 2017 ano
Indicadores de alterações dos valores ao longo dos anos
Mínimo:
40.583
1 jan 2011 ano
Máximo:
72.076
1 jan 1963 ano
Na data de observação
Valor
Mudança absoluta
A alteração em relação ao valor anterior
1 jan 1961 ano
52.783
+52.783
0.0%
1 jan 1962 ano
64.977
+12.194
23.1%
1 jan 1963 ano
72.076
+7.1
10.93%
1 jan 1964 ano
66.048
-6.028
-8.36%
1 jan 1965 ano
64.319
-1.729
-2.62%
1 jan 1966 ano
63.865
-0.454
-0.71%
1 jan 1967 ano
61.476
-2.39
-3.74%
1 jan 1968 ano
67.48
+6.005
9.77%
1 jan 1969 ano
66.049
-1.431
-2.12%
1 jan 1970 ano
64.959
-1.09
-1.65%
1 jan 1971 ano
58.894
-6.065
-9.34%
1 jan 1972 ano
56.892
-2.002
-3.4%
1 jan 1973 ano
58.108
+1.216
2.14%
1 jan 1974 ano
56.699
-1.409
-2.43%
1 jan 1975 ano
56.634
-0.065
-0.11%
1 jan 1976 ano
55.279
-1.355
-2.39%
1 jan 1977 ano
55.369
+0.09
0.16%
1 jan 1978 ano
54.694
-0.675
-1.22%
1 jan 1979 ano
51.538
-3.155
-5.77%
1 jan 1980 ano
51.656
+0.118
0.23%
1 jan 1981 ano
52.36
+0.704
1.36%
1 jan 1982 ano
54.283
+1.923
3.67%
1 jan 1983 ano
53.397
-0.886
-1.63%
1 jan 1984 ano
53.865
+0.467
0.87%
1 jan 1985 ano
52.0
-1.864
-3.46%
1 jan 1986 ano
52.07
+0.07
0.13%
1 jan 1987 ano
52.276
+0.206
0.4%
1 jan 1988 ano
50.758
-1.518
-2.9%
1 jan 1989 ano
50.778
+0.02
0.04%
1 jan 1990 ano
51.832
+1.054
2.08%
1 jan 1991 ano
50.792
-1.04
-2.01%
1 jan 1992 ano
49.084
-1.708
-3.36%
1 jan 1993 ano
47.236
-1.848
-3.76%
1 jan 1994 ano
46.525
-0.711
-1.51%
1 jan 1995 ano
46.552
+0.026
0.06%
1 jan 1996 ano
48.314
+1.763
3.79%
1 jan 1997 ano
48.904
+0.59
1.22%
1 jan 1998 ano
49.379
+0.474
0.97%
1 jan 1999 ano
48.379
-1.0
-2.03%
1 jan 2000 ano
49.514
+1.135
2.35%
1 jan 2001 ano
49.169
-0.345
-0.7%
1 jan 2002 ano
48.375
-0.794
-1.61%
1 jan 2003 ano
48.328
-0.047
-0.1%
1 jan 2004 ano
45.665
-2.663
-5.51%
1 jan 2005 ano
44.554
-1.111
-2.43%
1 jan 2006 ano
43.295
-1.258
-2.82%
1 jan 2007 ano
41.386
-1.909
-4.41%
1 jan 2008 ano
41.041
-0.346
-0.84%
1 jan 2009 ano
41.701
+0.661
1.61%
1 jan 2010 ano
40.975
-0.726
-1.74%
1 jan 2011 ano
40.583
-0.392
-0.96%
1 jan 2012 ano
41.348
+0.765
1.88%
1 jan 2013 ano
41.287
-0.061
-0.15%
1 jan 2014 ano
41.428
+0.141
0.34%
1 jan 2015 ano
41.709
+0.281
0.68%
1 jan 2016 ano
41.411
-0.298
-0.71%
Classificação de países por estatísticas atuais por anos


Comentários: