29
/pt/
pt
AIzaSyAYiBZKx7MnpbEhh9jyipgxe19OcubqV5w
April 1, 2024
141906
Greece
GRC
true
2
1
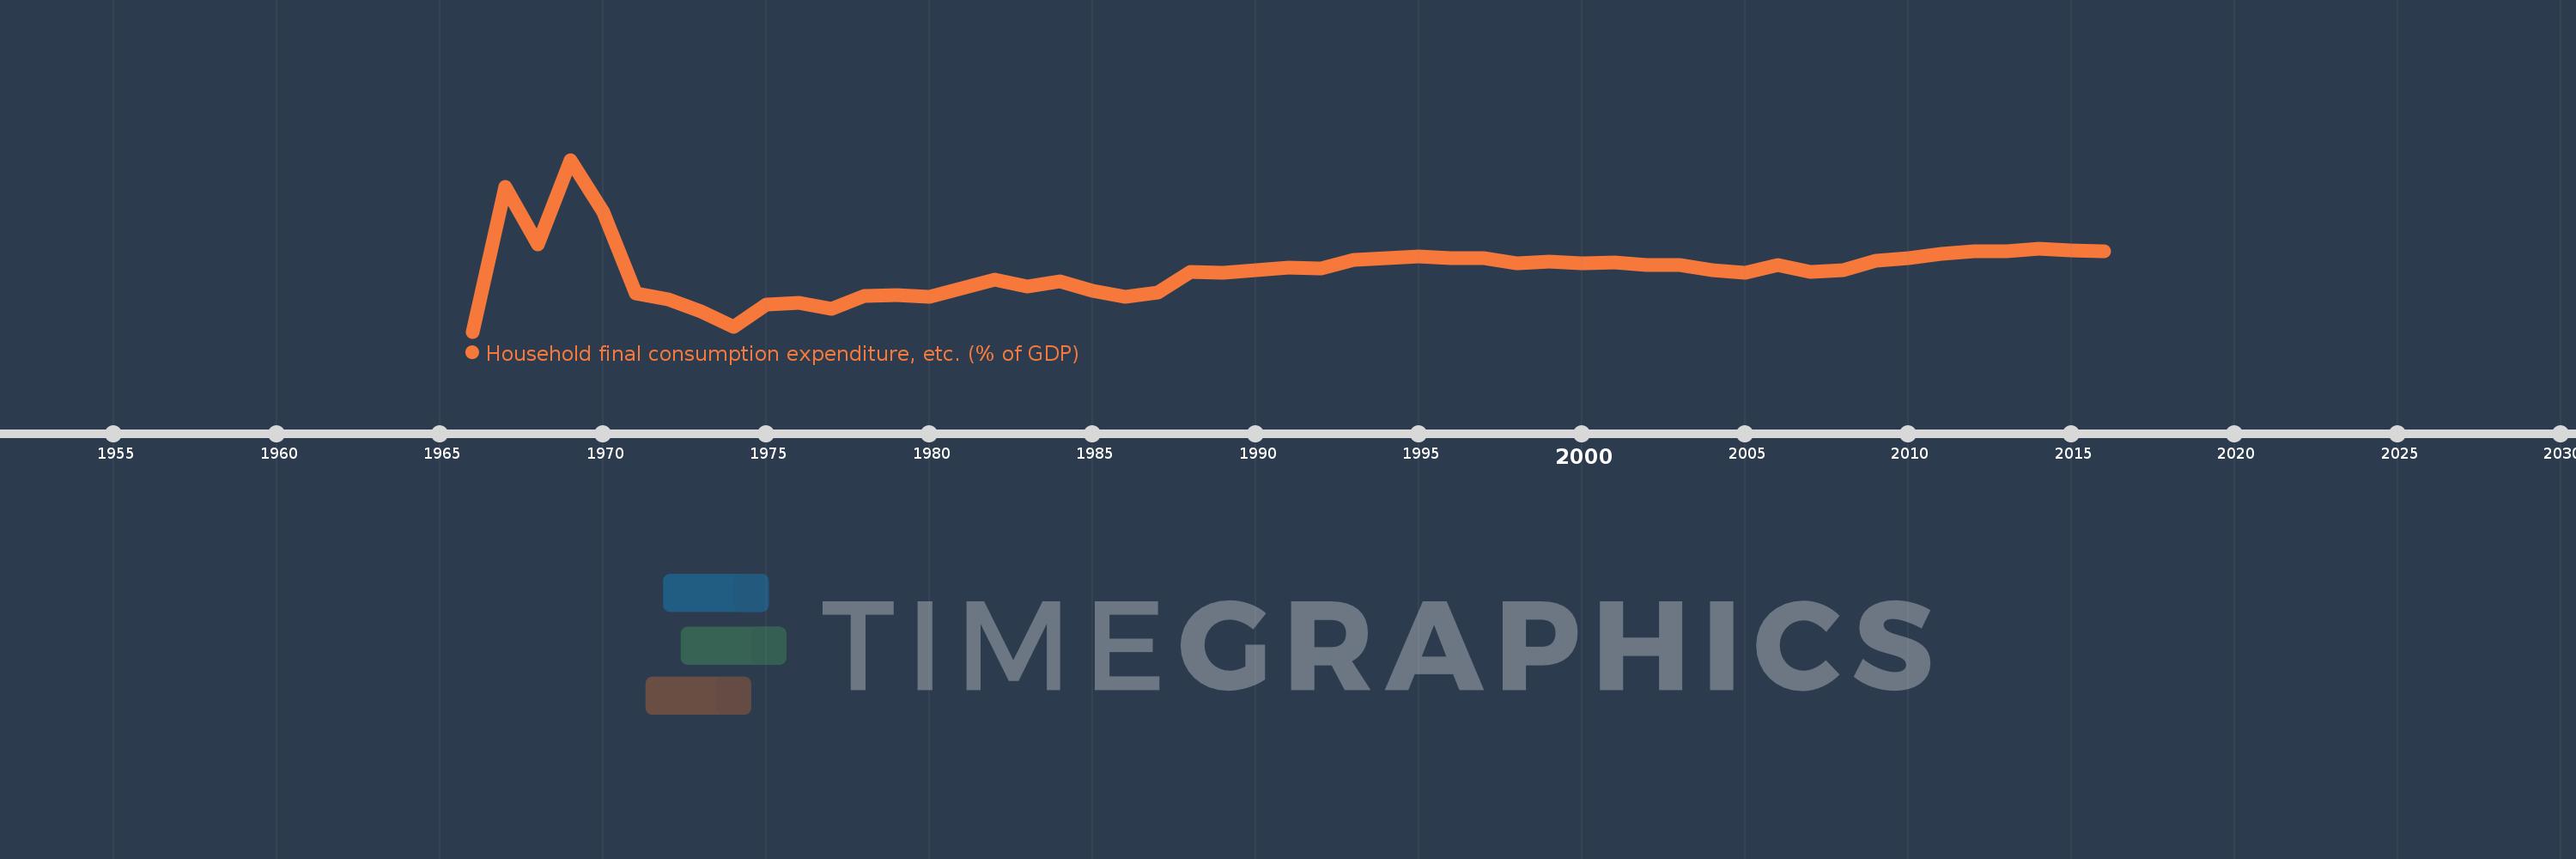
Household final consumption expenditure, etc. (% of GDP)
2016,2015,2014,2013,2012,2011,2010,2009,2008,2007,2006,2005,2004,2003,2002,2001,2000,1999,1998,1997,1996,1995,1994,1993,1992,1991,1990,1989,1988,1987,1986,1985,1984,1983,1982,1981,1980,1979,1978,1977,1976,1975,1974,1973,1972,1971,1970,1969,1968,1967,1966
Estas estatísticas em outros países:
AfghanistanAlbaniaAlgeriaAngolaAntigua and BarbudaArab WorldArgentinaArmeniaArubaAustraliaAustriaAzerbaijanBahamas, TheBahrainBangladeshBarbadosBelarusBelgiumBelizeBeninBermudaBhutanBoliviaBosnia and HerzegovinaBotswanaBrazilBrunei DarussalamBulgariaBurkina FasoBurundiCabo VerdeCambodiaCameroonCanadaCaribbean small statesCentral African RepublicCentral Europe and the BalticsChadChileChinaColombiaComorosCongo, Dem. Rep.Congo, Rep.Costa RicaCote d'IvoireCroatiaCubaCyprusCzech RepublicDenmarkDjiboutiDominicaDominican RepublicEarly-demographic dividendEast Asia & PacificEast Asia & Pacific (excluding high income)East Asia & Pacific (IDA & IBRD countries)EcuadorEgypt, Arab Rep.El SalvadorEquatorial GuineaEritreaEstoniaEthiopiaEuro areaEurope & Central AsiaEurope & Central Asia (excluding high income)Europe & Central Asia (IDA & IBRD countries)European UnionFaroe IslandsFijiFinlandFragile and conflict affected situationsFranceGabonGambia, TheGeorgiaGermanyGhanaGreeceGrenadaGuatemalaGuineaGuinea-BissauGuyanaHaitiHeavily indebted poor countries (HIPC)High incomeHondurasHong Kong SAR, ChinaHungaryIBRD onlyIcelandIDA & IBRD totalIDA blendIDA onlyIDA totalIndiaIndonesiaIran, Islamic Rep.IraqIrelandIsraelItalyJamaicaJapanJordanKazakhstanKenyaKiribatiKorea, Rep.KosovoKuwaitKyrgyz RepublicLao PDRLate-demographic dividendLatin America & Caribbean Latin America & Caribbean (excluding high income)Latin America & the Caribbean (IDA & IBRD countries)LatviaLeast developed countries: UN classificationLebanonLesothoLiberiaLibyaLithuaniaLow & middle incomeLow incomeLower middle incomeLuxembourgMacao SAR, ChinaMacedonia, FYRMadagascarMalawiMalaysiaMaldivesMaliMaltaMauritaniaMauritiusMexicoMicronesia, Fed. Sts.Middle East & North AfricaMiddle East & North Africa (excluding high income)Middle East & North Africa (IDA & IBRD countries)Middle incomeMoldovaMongoliaMontenegroMoroccoMozambiqueNamibiaNepalNetherlandsNew CaledoniaNew ZealandNicaraguaNigerNigeriaNorth AmericaNorwayOECD membersOmanOther small statesPacific island small statesPakistanPanamaPapua New GuineaParaguayPeruPhilippinesPolandPortugalPost-demographic dividendPre-demographic dividendPuerto RicoQatarRomaniaRussian FederationRwandaSaudi ArabiaSenegalSerbiaSeychellesSierra LeoneSingaporeSlovak RepublicSloveniaSmall statesSolomon IslandsSomaliaSouth AfricaSouth AsiaSouth Asia (IDA & IBRD)South SudanSpainSri LankaSt. Kitts and NevisSt. LuciaSt. Vincent and the GrenadinesSub-Saharan Africa Sub-Saharan Africa (excluding high income)Sub-Saharan Africa (IDA & IBRD countries)SudanSurinameSwazilandSwedenSwitzerlandSyrian Arab RepublicTajikistanTanzaniaThailandTimor-LesteTogoTongaTrinidad and TobagoTunisiaTurkeyTurkmenistanUgandaUkraineUnited Arab EmiratesUnited KingdomUnited StatesUpper middle incomeUruguayUzbekistanVanuatuVenezuela, RBVietnamWest Bank and GazaWorldYemen, Rep.ZambiaZimbabwe Linha do tempo:
Nesta escala de tempo está apresentado um gráfico de 1966 ano até 2016 ano Greece. Dados de 1965 ano ausente. O número de observações reais por data: 51.
Fonte (nome):
Indicadores de desenvolvimento mundial
Fonte (organização):
World Bank national accounts data, and OECD National Accounts data files.
Categorias:
Economy & Growth
Foi atualizado:
23 abr 2017 ano
Indicadores de alterações dos valores ao longo dos anos
Mínimo:
47.771
1 jan 1966 ano
Máximo:
95.25
1 jan 1969 ano
Na data de observação
Valor
Mudança absoluta
A alteração em relação ao valor anterior
1 jan 1966 ano
47.771
+47.771
0.0%
1 jan 1967 ano
87.661
+39.89
83.5%
1 jan 1968 ano
71.916
-15.745
-17.96%
1 jan 1969 ano
95.25
+23.334
32.45%
1 jan 1970 ano
80.843
-14.407
-15.13%
1 jan 1971 ano
58.25
-22.594
-27.95%
1 jan 1972 ano
56.556
-1.694
-2.91%
1 jan 1973 ano
53.338
-3.217
-5.69%
1 jan 1974 ano
49.104
-4.234
-7.94%
1 jan 1975 ano
55.161
+6.057
12.33%
1 jan 1976 ano
55.767
+0.607
1.1%
1 jan 1977 ano
53.998
-1.769
-3.17%
1 jan 1978 ano
57.524
+3.526
6.53%
1 jan 1979 ano
57.825
+0.301
0.52%
1 jan 1980 ano
57.449
-0.376
-0.65%
1 jan 1981 ano
59.698
+2.248
3.91%
1 jan 1982 ano
62.165
+2.467
4.13%
1 jan 1983 ano
60.243
-1.922
-3.09%
1 jan 1984 ano
61.586
+1.343
2.23%
1 jan 1985 ano
58.942
-2.644
-4.29%
1 jan 1986 ano
57.495
-1.447
-2.46%
1 jan 1987 ano
58.65
+1.155
2.01%
1 jan 1988 ano
64.368
+5.718
9.75%
1 jan 1989 ano
64.011
-0.356
-0.55%
1 jan 1990 ano
64.639
+0.628
0.98%
1 jan 1991 ano
65.531
+0.892
1.38%
1 jan 1992 ano
65.298
-0.233
-0.36%
1 jan 1993 ano
67.707
+2.408
3.69%
1 jan 1994 ano
68.149
+0.443
0.65%
1 jan 1995 ano
68.498
+0.349
0.51%
1 jan 1996 ano
67.993
-0.505
-0.74%
1 jan 1997 ano
67.961
-0.032
-0.05%
1 jan 1998 ano
66.706
-1.254
-1.85%
1 jan 1999 ano
67.002
+0.296
0.44%
1 jan 2000 ano
66.736
-0.266
-0.4%
1 jan 2001 ano
66.893
+0.158
0.24%
1 jan 2002 ano
66.156
-0.737
-1.1%
1 jan 2003 ano
66.146
-0.01
-0.01%
1 jan 2004 ano
64.767
-1.379
-2.08%
1 jan 2005 ano
64.02
-0.747
-1.15%
1 jan 2006 ano
66.157
+2.137
3.34%
1 jan 2007 ano
64.195
-1.962
-2.97%
1 jan 2008 ano
64.832
+0.638
0.99%
1 jan 2009 ano
67.374
+2.542
3.92%
1 jan 2010 ano
68.133
+0.758
1.13%
1 jan 2011 ano
69.372
+1.24
1.82%
1 jan 2012 ano
69.883
+0.511
0.74%
1 jan 2013 ano
69.908
+0.025
0.04%
1 jan 2014 ano
70.772
+0.864
1.24%
1 jan 2015 ano
70.297
-0.475
-0.67%
1 jan 2016 ano
69.912
-0.385
-0.55%
Classificação de países por estatísticas atuais por anos


Comentários: