29
/pt/
pt
AIzaSyAYiBZKx7MnpbEhh9jyipgxe19OcubqV5w
April 1, 2024
91247
Brazil
BRA
true
2
1
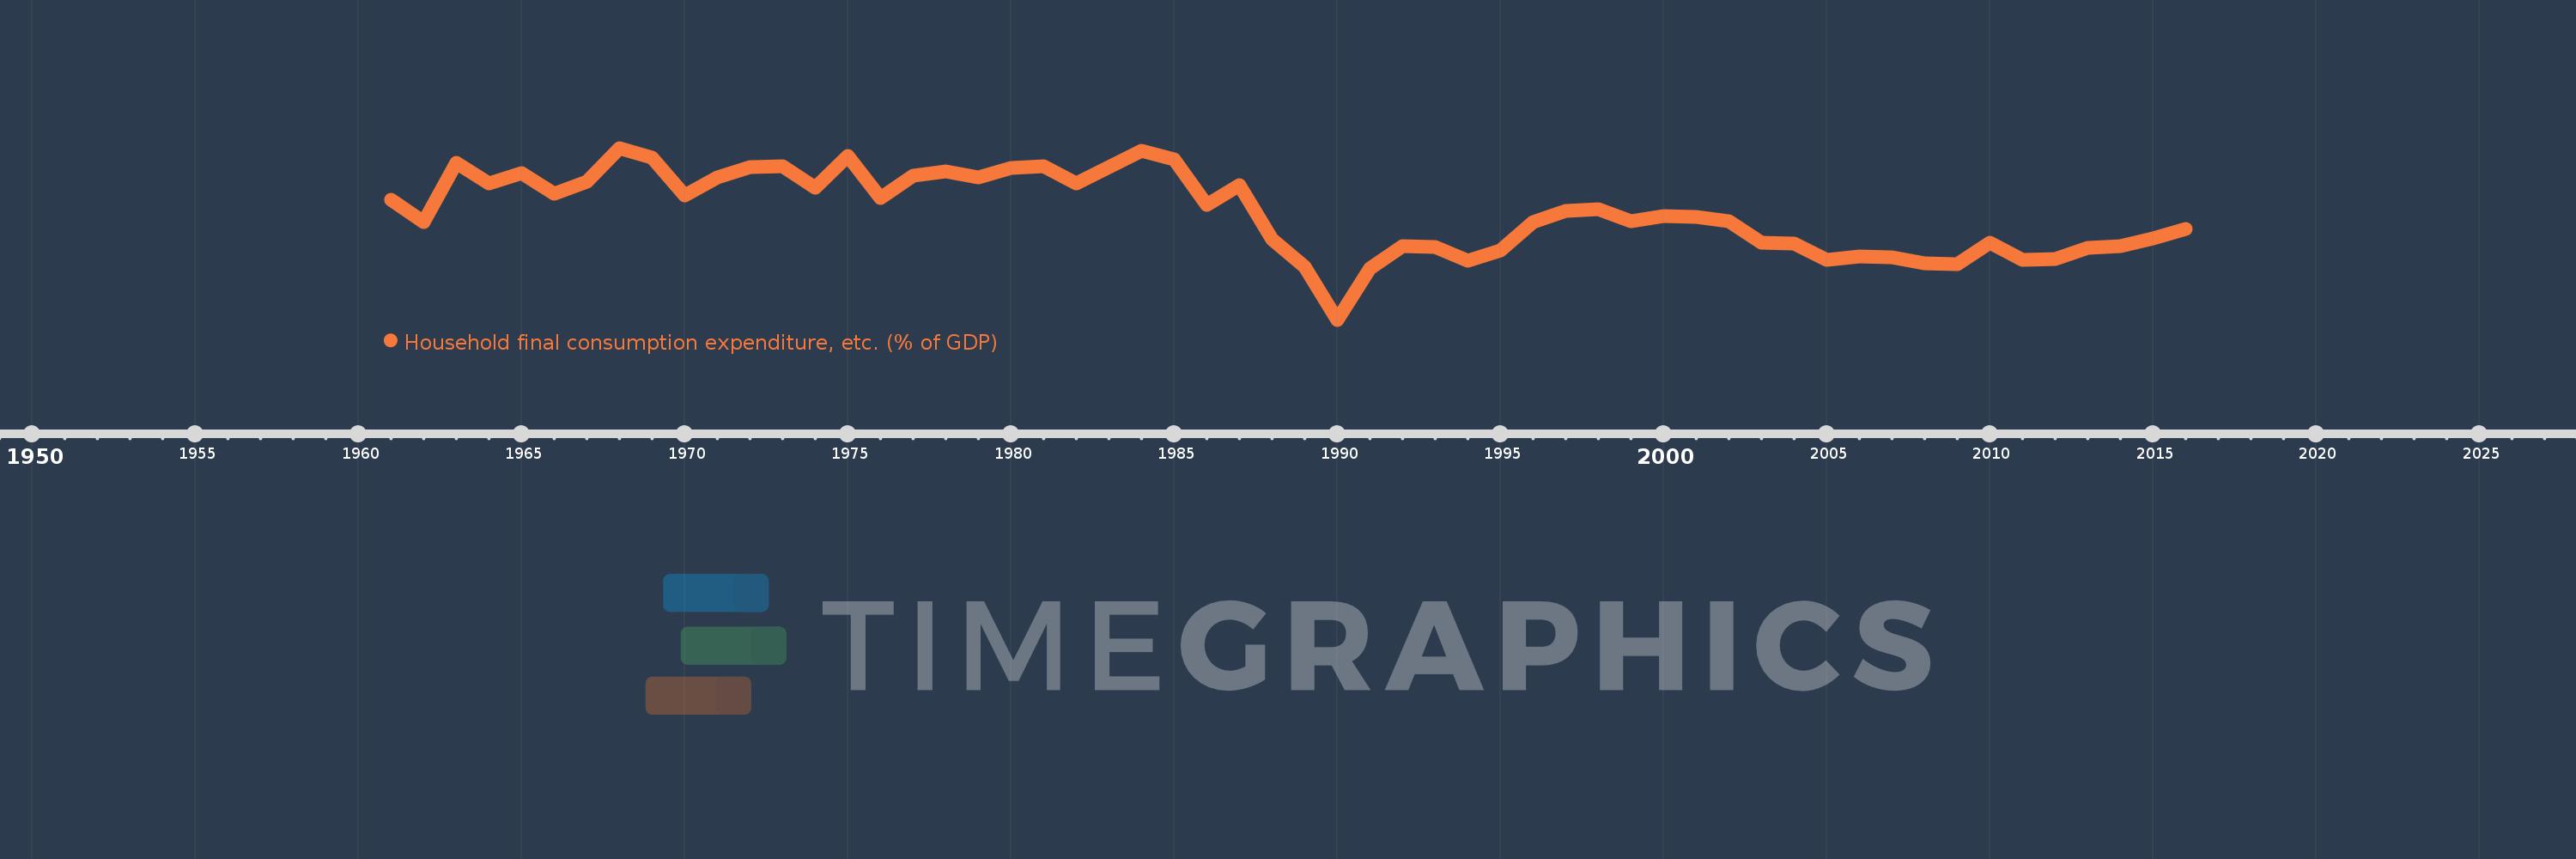
Household final consumption expenditure, etc. (% of GDP)
2016,2015,2014,2013,2012,2011,2010,2009,2008,2007,2006,2005,2004,2003,2002,2001,2000,1999,1998,1997,1996,1995,1994,1993,1992,1991,1990,1989,1988,1987,1986,1985,1984,1983,1982,1981,1980,1979,1978,1977,1976,1975,1974,1973,1972,1971,1970,1969,1968,1967,1966,1965,1964,1963,1962,1961
Estas estatísticas em outros países:
AfghanistanAlbaniaAlgeriaAngolaAntigua and BarbudaArab WorldArgentinaArmeniaArubaAustraliaAustriaAzerbaijanBahamas, TheBahrainBangladeshBarbadosBelarusBelgiumBelizeBeninBermudaBhutanBoliviaBosnia and HerzegovinaBotswanaBrazilBrunei DarussalamBulgariaBurkina FasoBurundiCabo VerdeCambodiaCameroonCanadaCaribbean small statesCentral African RepublicCentral Europe and the BalticsChadChileChinaColombiaComorosCongo, Dem. Rep.Congo, Rep.Costa RicaCote d'IvoireCroatiaCubaCyprusCzech RepublicDenmarkDjiboutiDominicaDominican RepublicEarly-demographic dividendEast Asia & PacificEast Asia & Pacific (excluding high income)East Asia & Pacific (IDA & IBRD countries)EcuadorEgypt, Arab Rep.El SalvadorEquatorial GuineaEritreaEstoniaEthiopiaEuro areaEurope & Central AsiaEurope & Central Asia (excluding high income)Europe & Central Asia (IDA & IBRD countries)European UnionFaroe IslandsFijiFinlandFragile and conflict affected situationsFranceGabonGambia, TheGeorgiaGermanyGhanaGreeceGrenadaGuatemalaGuineaGuinea-BissauGuyanaHaitiHeavily indebted poor countries (HIPC)High incomeHondurasHong Kong SAR, ChinaHungaryIBRD onlyIcelandIDA & IBRD totalIDA blendIDA onlyIDA totalIndiaIndonesiaIran, Islamic Rep.IraqIrelandIsraelItalyJamaicaJapanJordanKazakhstanKenyaKiribatiKorea, Rep.KosovoKuwaitKyrgyz RepublicLao PDRLate-demographic dividendLatin America & Caribbean Latin America & Caribbean (excluding high income)Latin America & the Caribbean (IDA & IBRD countries)LatviaLeast developed countries: UN classificationLebanonLesothoLiberiaLibyaLithuaniaLow & middle incomeLow incomeLower middle incomeLuxembourgMacao SAR, ChinaMacedonia, FYRMadagascarMalawiMalaysiaMaldivesMaliMaltaMauritaniaMauritiusMexicoMicronesia, Fed. Sts.Middle East & North AfricaMiddle East & North Africa (excluding high income)Middle East & North Africa (IDA & IBRD countries)Middle incomeMoldovaMongoliaMontenegroMoroccoMozambiqueNamibiaNepalNetherlandsNew CaledoniaNew ZealandNicaraguaNigerNigeriaNorth AmericaNorwayOECD membersOmanOther small statesPacific island small statesPakistanPanamaPapua New GuineaParaguayPeruPhilippinesPolandPortugalPost-demographic dividendPre-demographic dividendPuerto RicoQatarRomaniaRussian FederationRwandaSaudi ArabiaSenegalSerbiaSeychellesSierra LeoneSingaporeSlovak RepublicSloveniaSmall statesSolomon IslandsSomaliaSouth AfricaSouth AsiaSouth Asia (IDA & IBRD)South SudanSpainSri LankaSt. Kitts and NevisSt. LuciaSt. Vincent and the GrenadinesSub-Saharan Africa Sub-Saharan Africa (excluding high income)Sub-Saharan Africa (IDA & IBRD countries)SudanSurinameSwazilandSwedenSwitzerlandSyrian Arab RepublicTajikistanTanzaniaThailandTimor-LesteTogoTongaTrinidad and TobagoTunisiaTurkeyTurkmenistanUgandaUkraineUnited Arab EmiratesUnited KingdomUnited StatesUpper middle incomeUruguayUzbekistanVanuatuVenezuela, RBVietnamWest Bank and GazaWorldYemen, Rep.ZambiaZimbabwe Linha do tempo:
Nesta escala de tempo está apresentado um gráfico de 1961 ano até 2016 ano Brazil. Dados de 1960 ano ausente. O número de observações reais por data: 56.
Fonte (nome):
Indicadores de desenvolvimento mundial
Fonte (organização):
World Bank national accounts data, and OECD National Accounts data files.
Categorias:
Economy & Growth
Foi atualizado:
23 abr 2017 ano
Indicadores de alterações dos valores ao longo dos anos
Mínimo:
54.13
1 jan 1990 ano
Máximo:
71.543
1 jan 1968 ano
Na data de observação
Valor
Mudança absoluta
A alteração em relação ao valor anterior
1 jan 1961 ano
66.276
+66.276
0.0%
1 jan 1962 ano
64.059
-2.217
-3.34%
1 jan 1963 ano
70.041
+5.982
9.34%
1 jan 1964 ano
67.931
-2.11
-3.01%
1 jan 1965 ano
68.976
+1.046
1.54%
1 jan 1966 ano
66.924
-2.053
-2.98%
1 jan 1967 ano
68.124
+1.2
1.79%
1 jan 1968 ano
71.543
+3.42
5.02%
1 jan 1969 ano
70.559
-0.984
-1.38%
1 jan 1970 ano
66.766
-3.793
-5.38%
1 jan 1971 ano
68.554
+1.787
2.68%
1 jan 1972 ano
69.584
+1.03
1.5%
1 jan 1973 ano
69.661
+0.077
0.11%
1 jan 1974 ano
67.54
-2.121
-3.04%
1 jan 1975 ano
70.739
+3.198
4.74%
1 jan 1976 ano
66.491
-4.248
-6.01%
1 jan 1977 ano
68.76
+2.269
3.41%
1 jan 1978 ano
69.161
+0.401
0.58%
1 jan 1979 ano
68.56
-0.6
-0.87%
1 jan 1980 ano
69.547
+0.986
1.44%
1 jan 1981 ano
69.709
+0.162
0.23%
1 jan 1982 ano
67.977
-1.732
-2.48%
1 jan 1983 ano
69.565
+1.589
2.34%
1 jan 1984 ano
71.244
+1.678
2.41%
1 jan 1985 ano
70.351
-0.892
-1.25%
1 jan 1986 ano
65.777
-4.574
-6.5%
1 jan 1987 ano
67.771
+1.994
3.03%
1 jan 1988 ano
62.264
-5.506
-8.12%
1 jan 1989 ano
59.494
-2.771
-4.45%
1 jan 1990 ano
54.13
-5.364
-9.02%
1 jan 1991 ano
59.303
+5.173
9.56%
1 jan 1992 ano
61.568
+2.265
3.82%
1 jan 1993 ano
61.519
-0.049
-0.08%
1 jan 1994 ano
60.082
-1.437
-2.34%
1 jan 1995 ano
61.178
+1.095
1.82%
1 jan 1996 ano
64.069
+2.892
4.73%
1 jan 1997 ano
65.157
+1.088
1.7%
1 jan 1998 ano
65.309
+0.152
0.23%
1 jan 1999 ano
64.142
-1.167
-1.79%
1 jan 2000 ano
64.68
+0.538
0.84%
1 jan 2001 ano
64.593
-0.087
-0.14%
1 jan 2002 ano
64.108
-0.485
-0.75%
1 jan 2003 ano
61.898
-2.21
-3.45%
1 jan 2004 ano
61.845
-0.054
-0.09%
1 jan 2005 ano
60.207
-1.638
-2.65%
1 jan 2006 ano
60.504
+0.298
0.49%
1 jan 2007 ano
60.438
-0.067
-0.11%
1 jan 2008 ano
59.875
-0.563
-0.93%
1 jan 2009 ano
59.731
-0.144
-0.24%
1 jan 2010 ano
61.957
+2.226
3.73%
1 jan 2011 ano
60.223
-1.734
-2.8%
1 jan 2012 ano
60.268
+0.045
0.07%
1 jan 2013 ano
61.376
+1.108
1.84%
1 jan 2014 ano
61.621
+0.245
0.4%
1 jan 2015 ano
62.374
+0.753
1.22%
1 jan 2016 ano
63.375
+1.0
1.6%
Classificação de países por estatísticas atuais por anos


Comentários: