29
/pt/
pt
AIzaSyAYiBZKx7MnpbEhh9jyipgxe19OcubqV5w
April 1, 2024
111034
Congo, Rep.
COG
true
2
1
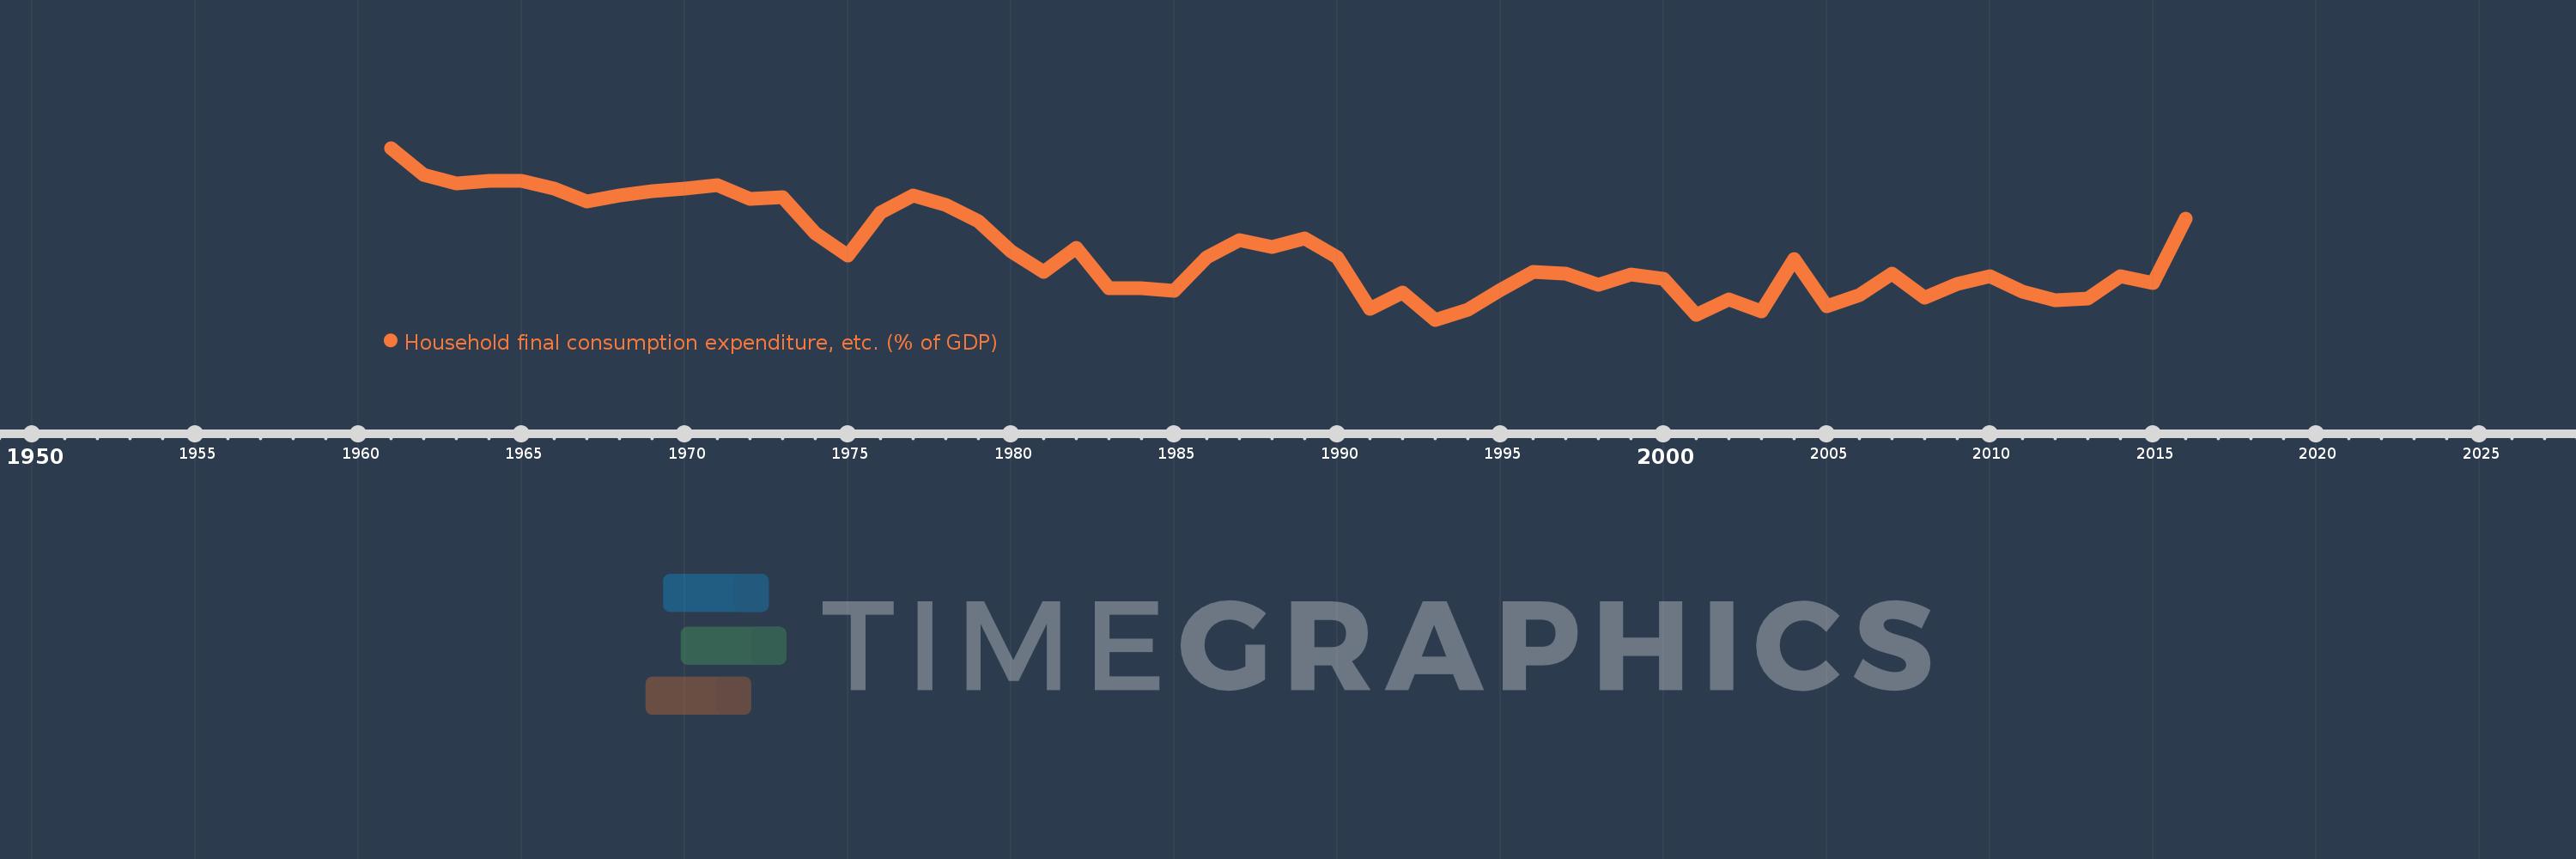
Household final consumption expenditure, etc. (% of GDP)
2016,2015,2014,2013,2012,2011,2010,2009,2008,2007,2006,2005,2004,2003,2002,2001,2000,1999,1998,1997,1996,1995,1994,1993,1992,1991,1990,1989,1988,1987,1986,1985,1984,1983,1982,1981,1980,1979,1978,1977,1976,1975,1974,1973,1972,1971,1970,1969,1968,1967,1966,1965,1964,1963,1962,1961
Estas estatísticas em outros países:
AfghanistanAlbaniaAlgeriaAngolaAntigua and BarbudaArab WorldArgentinaArmeniaArubaAustraliaAustriaAzerbaijanBahamas, TheBahrainBangladeshBarbadosBelarusBelgiumBelizeBeninBermudaBhutanBoliviaBosnia and HerzegovinaBotswanaBrazilBrunei DarussalamBulgariaBurkina FasoBurundiCabo VerdeCambodiaCameroonCanadaCaribbean small statesCentral African RepublicCentral Europe and the BalticsChadChileChinaColombiaComorosCongo, Dem. Rep.Congo, Rep.Costa RicaCote d'IvoireCroatiaCubaCyprusCzech RepublicDenmarkDjiboutiDominicaDominican RepublicEarly-demographic dividendEast Asia & PacificEast Asia & Pacific (excluding high income)East Asia & Pacific (IDA & IBRD countries)EcuadorEgypt, Arab Rep.El SalvadorEquatorial GuineaEritreaEstoniaEthiopiaEuro areaEurope & Central AsiaEurope & Central Asia (excluding high income)Europe & Central Asia (IDA & IBRD countries)European UnionFaroe IslandsFijiFinlandFragile and conflict affected situationsFranceGabonGambia, TheGeorgiaGermanyGhanaGreeceGrenadaGuatemalaGuineaGuinea-BissauGuyanaHaitiHeavily indebted poor countries (HIPC)High incomeHondurasHong Kong SAR, ChinaHungaryIBRD onlyIcelandIDA & IBRD totalIDA blendIDA onlyIDA totalIndiaIndonesiaIran, Islamic Rep.IraqIrelandIsraelItalyJamaicaJapanJordanKazakhstanKenyaKiribatiKorea, Rep.KosovoKuwaitKyrgyz RepublicLao PDRLate-demographic dividendLatin America & Caribbean Latin America & Caribbean (excluding high income)Latin America & the Caribbean (IDA & IBRD countries)LatviaLeast developed countries: UN classificationLebanonLesothoLiberiaLibyaLithuaniaLow & middle incomeLow incomeLower middle incomeLuxembourgMacao SAR, ChinaMacedonia, FYRMadagascarMalawiMalaysiaMaldivesMaliMaltaMauritaniaMauritiusMexicoMicronesia, Fed. Sts.Middle East & North AfricaMiddle East & North Africa (excluding high income)Middle East & North Africa (IDA & IBRD countries)Middle incomeMoldovaMongoliaMontenegroMoroccoMozambiqueNamibiaNepalNetherlandsNew CaledoniaNew ZealandNicaraguaNigerNigeriaNorth AmericaNorwayOECD membersOmanOther small statesPacific island small statesPakistanPanamaPapua New GuineaParaguayPeruPhilippinesPolandPortugalPost-demographic dividendPre-demographic dividendPuerto RicoQatarRomaniaRussian FederationRwandaSaudi ArabiaSenegalSerbiaSeychellesSierra LeoneSingaporeSlovak RepublicSloveniaSmall statesSolomon IslandsSomaliaSouth AfricaSouth AsiaSouth Asia (IDA & IBRD)South SudanSpainSri LankaSt. Kitts and NevisSt. LuciaSt. Vincent and the GrenadinesSub-Saharan Africa Sub-Saharan Africa (excluding high income)Sub-Saharan Africa (IDA & IBRD countries)SudanSurinameSwazilandSwedenSwitzerlandSyrian Arab RepublicTajikistanTanzaniaThailandTimor-LesteTogoTongaTrinidad and TobagoTunisiaTurkeyTurkmenistanUgandaUkraineUnited Arab EmiratesUnited KingdomUnited StatesUpper middle incomeUruguayUzbekistanVanuatuVenezuela, RBVietnamWest Bank and GazaWorldYemen, Rep.ZambiaZimbabwe Linha do tempo:
Nesta escala de tempo está apresentado um gráfico de 1961 ano até 2016 ano Congo, Rep.. Dados de 1960 ano ausente. O número de observações reais por data: 56.
Fonte (nome):
Indicadores de desenvolvimento mundial
Fonte (organização):
World Bank national accounts data, and OECD National Accounts data files.
Categorias:
Economy & Growth
Foi atualizado:
23 abr 2017 ano
Indicadores de alterações dos valores ao longo dos anos
Mínimo:
27.225
1 jan 1993 ano
Máximo:
96.871
1 jan 1961 ano
Na data de observação
Valor
Mudança absoluta
A alteração em relação ao valor anterior
1 jan 1961 ano
96.871
+96.871
0.0%
1 jan 1962 ano
85.946
-10.925
-11.28%
1 jan 1963 ano
82.409
-3.537
-4.12%
1 jan 1964 ano
83.373
+0.964
1.17%
1 jan 1965 ano
83.428
+0.055
0.07%
1 jan 1966 ano
80.453
-2.975
-3.57%
1 jan 1967 ano
75.277
-5.176
-6.43%
1 jan 1968 ano
77.74
+2.463
3.27%
1 jan 1969 ano
79.26
+1.521
1.96%
1 jan 1970 ano
80.406
+1.146
1.45%
1 jan 1971 ano
81.842
+1.436
1.79%
1 jan 1972 ano
76.325
-5.517
-6.74%
1 jan 1973 ano
77.005
+0.68
0.89%
1 jan 1974 ano
62.252
-14.753
-19.16%
1 jan 1975 ano
53.371
-8.88
-14.27%
1 jan 1976 ano
70.742
+17.371
32.55%
1 jan 1977 ano
77.482
+6.74
9.53%
1 jan 1978 ano
73.724
-3.758
-4.85%
1 jan 1979 ano
67.07
-6.653
-9.02%
1 jan 1980 ano
54.863
-12.208
-18.2%
1 jan 1981 ano
46.754
-8.109
-14.78%
1 jan 1982 ano
56.47
+9.717
20.78%
1 jan 1983 ano
40.014
-16.456
-29.14%
1 jan 1984 ano
39.84
-0.174
-0.44%
1 jan 1985 ano
38.821
-1.019
-2.56%
1 jan 1986 ano
52.482
+13.661
35.19%
1 jan 1987 ano
59.432
+6.949
13.24%
1 jan 1988 ano
56.581
-2.851
-4.8%
1 jan 1989 ano
60.137
+3.556
6.28%
1 jan 1990 ano
52.683
-7.454
-12.39%
1 jan 1991 ano
31.805
-20.877
-39.63%
1 jan 1992 ano
38.147
+6.342
19.94%
1 jan 1993 ano
27.225
-10.922
-28.63%
1 jan 1994 ano
31.346
+4.121
15.14%
1 jan 1995 ano
39.402
+8.056
25.7%
1 jan 1996 ano
46.607
+7.205
18.29%
1 jan 1997 ano
45.855
-0.752
-1.61%
1 jan 1998 ano
41.384
-4.471
-9.75%
1 jan 1999 ano
45.466
+4.082
9.86%
1 jan 2000 ano
43.984
-1.482
-3.26%
1 jan 2001 ano
29.122
-14.862
-33.79%
1 jan 2002 ano
35.446
+6.324
21.72%
1 jan 2003 ano
30.658
-4.788
-13.51%
1 jan 2004 ano
51.788
+21.129
68.92%
1 jan 2005 ano
32.816
-18.972
-36.63%
1 jan 2006 ano
37.163
+4.347
13.25%
1 jan 2007 ano
45.899
+8.736
23.51%
1 jan 2008 ano
36.21
-9.689
-21.11%
1 jan 2009 ano
41.6
+5.39
14.89%
1 jan 2010 ano
45.042
+3.442
8.28%
1 jan 2011 ano
38.615
-6.428
-14.27%
1 jan 2012 ano
35.293
-3.322
-8.6%
1 jan 2013 ano
35.908
+0.614
1.74%
1 jan 2014 ano
45.044
+9.136
25.44%
1 jan 2015 ano
42.129
-2.915
-6.47%
1 jan 2016 ano
68.085
+25.956
61.61%
Classificação de países por estatísticas atuais por anos


Comentários: