29
/pt/
pt
AIzaSyAYiBZKx7MnpbEhh9jyipgxe19OcubqV5w
April 1, 2024
216527
Pakistan
PAK
true
2
1
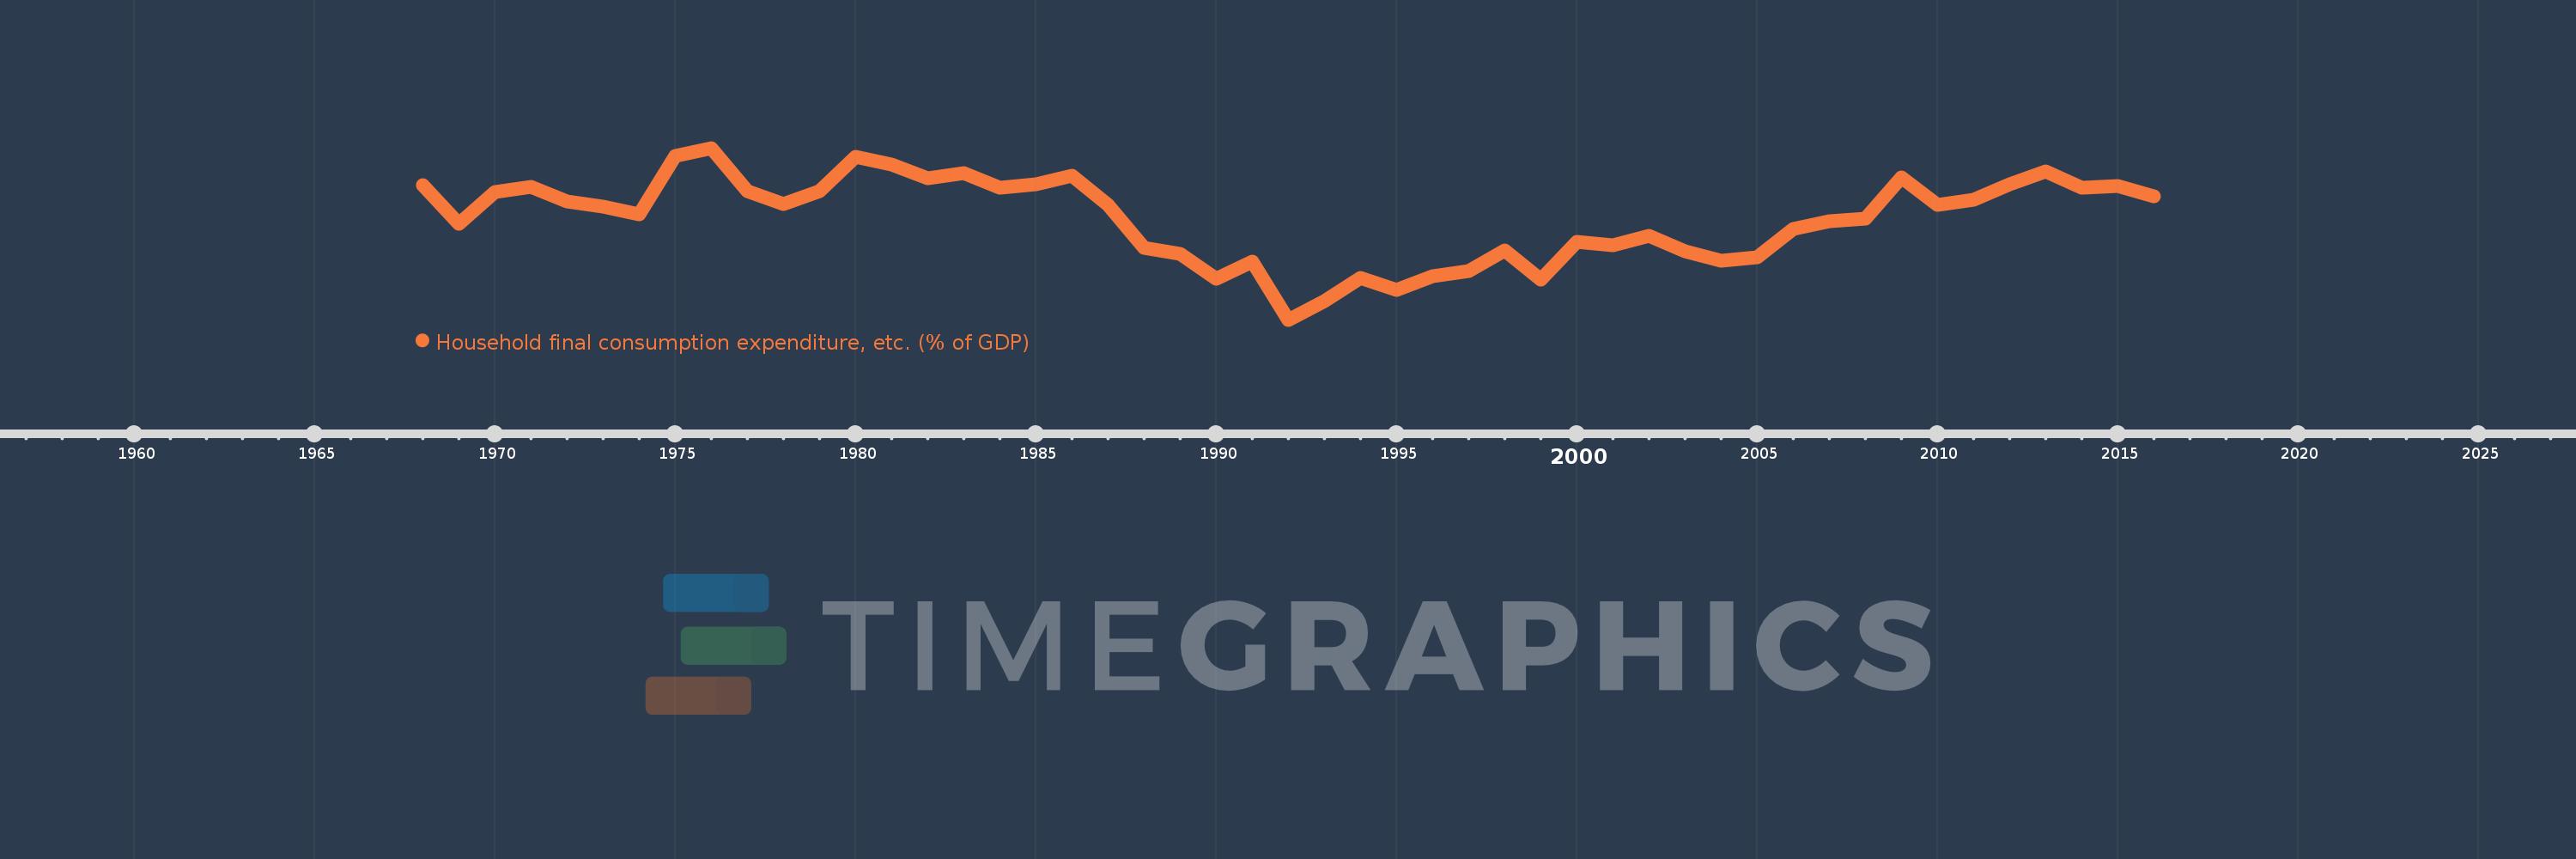
Household final consumption expenditure, etc. (% of GDP)
2016,2015,2014,2013,2012,2011,2010,2009,2008,2007,2006,2005,2004,2003,2002,2001,2000,1999,1998,1997,1996,1995,1994,1993,1992,1991,1990,1989,1988,1987,1986,1985,1984,1983,1982,1981,1980,1979,1978,1977,1976,1975,1974,1973,1972,1971,1970,1969,1968
Estas estatísticas em outros países:
AfghanistanAlbaniaAlgeriaAngolaAntigua and BarbudaArab WorldArgentinaArmeniaArubaAustraliaAustriaAzerbaijanBahamas, TheBahrainBangladeshBarbadosBelarusBelgiumBelizeBeninBermudaBhutanBoliviaBosnia and HerzegovinaBotswanaBrazilBrunei DarussalamBulgariaBurkina FasoBurundiCabo VerdeCambodiaCameroonCanadaCaribbean small statesCentral African RepublicCentral Europe and the BalticsChadChileChinaColombiaComorosCongo, Dem. Rep.Congo, Rep.Costa RicaCote d'IvoireCroatiaCubaCyprusCzech RepublicDenmarkDjiboutiDominicaDominican RepublicEarly-demographic dividendEast Asia & PacificEast Asia & Pacific (excluding high income)East Asia & Pacific (IDA & IBRD countries)EcuadorEgypt, Arab Rep.El SalvadorEquatorial GuineaEritreaEstoniaEthiopiaEuro areaEurope & Central AsiaEurope & Central Asia (excluding high income)Europe & Central Asia (IDA & IBRD countries)European UnionFaroe IslandsFijiFinlandFragile and conflict affected situationsFranceGabonGambia, TheGeorgiaGermanyGhanaGreeceGrenadaGuatemalaGuineaGuinea-BissauGuyanaHaitiHeavily indebted poor countries (HIPC)High incomeHondurasHong Kong SAR, ChinaHungaryIBRD onlyIcelandIDA & IBRD totalIDA blendIDA onlyIDA totalIndiaIndonesiaIran, Islamic Rep.IraqIrelandIsraelItalyJamaicaJapanJordanKazakhstanKenyaKiribatiKorea, Rep.KosovoKuwaitKyrgyz RepublicLao PDRLate-demographic dividendLatin America & Caribbean Latin America & Caribbean (excluding high income)Latin America & the Caribbean (IDA & IBRD countries)LatviaLeast developed countries: UN classificationLebanonLesothoLiberiaLibyaLithuaniaLow & middle incomeLow incomeLower middle incomeLuxembourgMacao SAR, ChinaMacedonia, FYRMadagascarMalawiMalaysiaMaldivesMaliMaltaMauritaniaMauritiusMexicoMicronesia, Fed. Sts.Middle East & North AfricaMiddle East & North Africa (excluding high income)Middle East & North Africa (IDA & IBRD countries)Middle incomeMoldovaMongoliaMontenegroMoroccoMozambiqueNamibiaNepalNetherlandsNew CaledoniaNew ZealandNicaraguaNigerNigeriaNorth AmericaNorwayOECD membersOmanOther small statesPacific island small statesPakistanPanamaPapua New GuineaParaguayPeruPhilippinesPolandPortugalPost-demographic dividendPre-demographic dividendPuerto RicoQatarRomaniaRussian FederationRwandaSaudi ArabiaSenegalSerbiaSeychellesSierra LeoneSingaporeSlovak RepublicSloveniaSmall statesSolomon IslandsSomaliaSouth AfricaSouth AsiaSouth Asia (IDA & IBRD)South SudanSpainSri LankaSt. Kitts and NevisSt. LuciaSt. Vincent and the GrenadinesSub-Saharan Africa Sub-Saharan Africa (excluding high income)Sub-Saharan Africa (IDA & IBRD countries)SudanSurinameSwazilandSwedenSwitzerlandSyrian Arab RepublicTajikistanTanzaniaThailandTimor-LesteTogoTongaTrinidad and TobagoTunisiaTurkeyTurkmenistanUgandaUkraineUnited Arab EmiratesUnited KingdomUnited StatesUpper middle incomeUruguayUzbekistanVanuatuVenezuela, RBVietnamWest Bank and GazaWorldYemen, Rep.ZambiaZimbabwe Linha do tempo:
Nesta escala de tempo está apresentado um gráfico de 1968 ano até 2016 ano Pakistan. Dados de 1967 ano ausente. O número de observações reais por data: 49.
Fonte (nome):
Indicadores de desenvolvimento mundial
Fonte (organização):
World Bank national accounts data, and OECD National Accounts data files.
Categorias:
Economy & Growth
Foi atualizado:
23 abr 2017 ano
Indicadores de alterações dos valores ao longo dos anos
Mínimo:
68.216
1 jan 1992 ano
Máximo:
84.667
1 jan 1976 ano
Na data de observação
Valor
Mudança absoluta
A alteração em relação ao valor anterior
1 jan 1968 ano
81.094
+81.094
0.0%
1 jan 1969 ano
77.368
-3.726
-4.6%
1 jan 1970 ano
80.47
+3.102
4.01%
1 jan 1971 ano
80.959
+0.49
0.61%
1 jan 1972 ano
79.578
-1.382
-1.71%
1 jan 1973 ano
79.049
-0.528
-0.66%
1 jan 1974 ano
78.296
-0.753
-0.95%
1 jan 1975 ano
83.893
+5.597
7.15%
1 jan 1976 ano
84.667
+0.774
0.92%
1 jan 1977 ano
80.547
-4.12
-4.87%
1 jan 1978 ano
79.305
-1.242
-1.54%
1 jan 1979 ano
80.545
+1.24
1.56%
1 jan 1980 ano
83.816
+3.272
4.06%
1 jan 1981 ano
83.096
-0.721
-0.86%
1 jan 1982 ano
81.757
-1.339
-1.61%
1 jan 1983 ano
82.216
+0.46
0.56%
1 jan 1984 ano
80.841
-1.375
-1.67%
1 jan 1985 ano
81.198
+0.357
0.44%
1 jan 1986 ano
81.972
+0.773
0.95%
1 jan 1987 ano
79.23
-2.742
-3.34%
1 jan 1988 ano
75.1
-4.13
-5.21%
1 jan 1989 ano
74.559
-0.541
-0.72%
1 jan 1990 ano
72.167
-2.392
-3.21%
1 jan 1991 ano
73.761
+1.593
2.21%
1 jan 1992 ano
68.216
-5.544
-7.52%
1 jan 1993 ano
70.025
+1.808
2.65%
1 jan 1994 ano
72.212
+2.188
3.12%
1 jan 1995 ano
71.102
-1.11
-1.54%
1 jan 1996 ano
72.424
+1.322
1.86%
1 jan 1997 ano
72.882
+0.458
0.63%
1 jan 1998 ano
74.876
+1.993
2.74%
1 jan 1999 ano
72.067
-2.809
-3.75%
1 jan 2000 ano
75.688
+3.621
5.02%
1 jan 2001 ano
75.377
-0.311
-0.41%
1 jan 2002 ano
76.275
+0.898
1.19%
1 jan 2003 ano
74.784
-1.492
-1.96%
1 jan 2004 ano
73.856
-0.928
-1.24%
1 jan 2005 ano
74.189
+0.333
0.45%
1 jan 2006 ano
76.949
+2.759
3.72%
1 jan 2007 ano
77.646
+0.697
0.91%
1 jan 2008 ano
77.9
+0.255
0.33%
1 jan 2009 ano
81.874
+3.974
5.1%
1 jan 2010 ano
79.212
-2.662
-3.25%
1 jan 2011 ano
79.716
+0.504
0.64%
1 jan 2012 ano
81.15
+1.434
1.8%
1 jan 2013 ano
82.447
+1.298
1.6%
1 jan 2014 ano
80.819
-1.629
-1.98%
1 jan 2015 ano
81.018
+0.199
0.25%
1 jan 2016 ano
80.002
-1.015
-1.25%
Classificação de países por estatísticas atuais por anos


Comentários: