29
/pt/
pt
AIzaSyAYiBZKx7MnpbEhh9jyipgxe19OcubqV5w
April 1, 2024
253120
Sudan
SDN
true
2
1
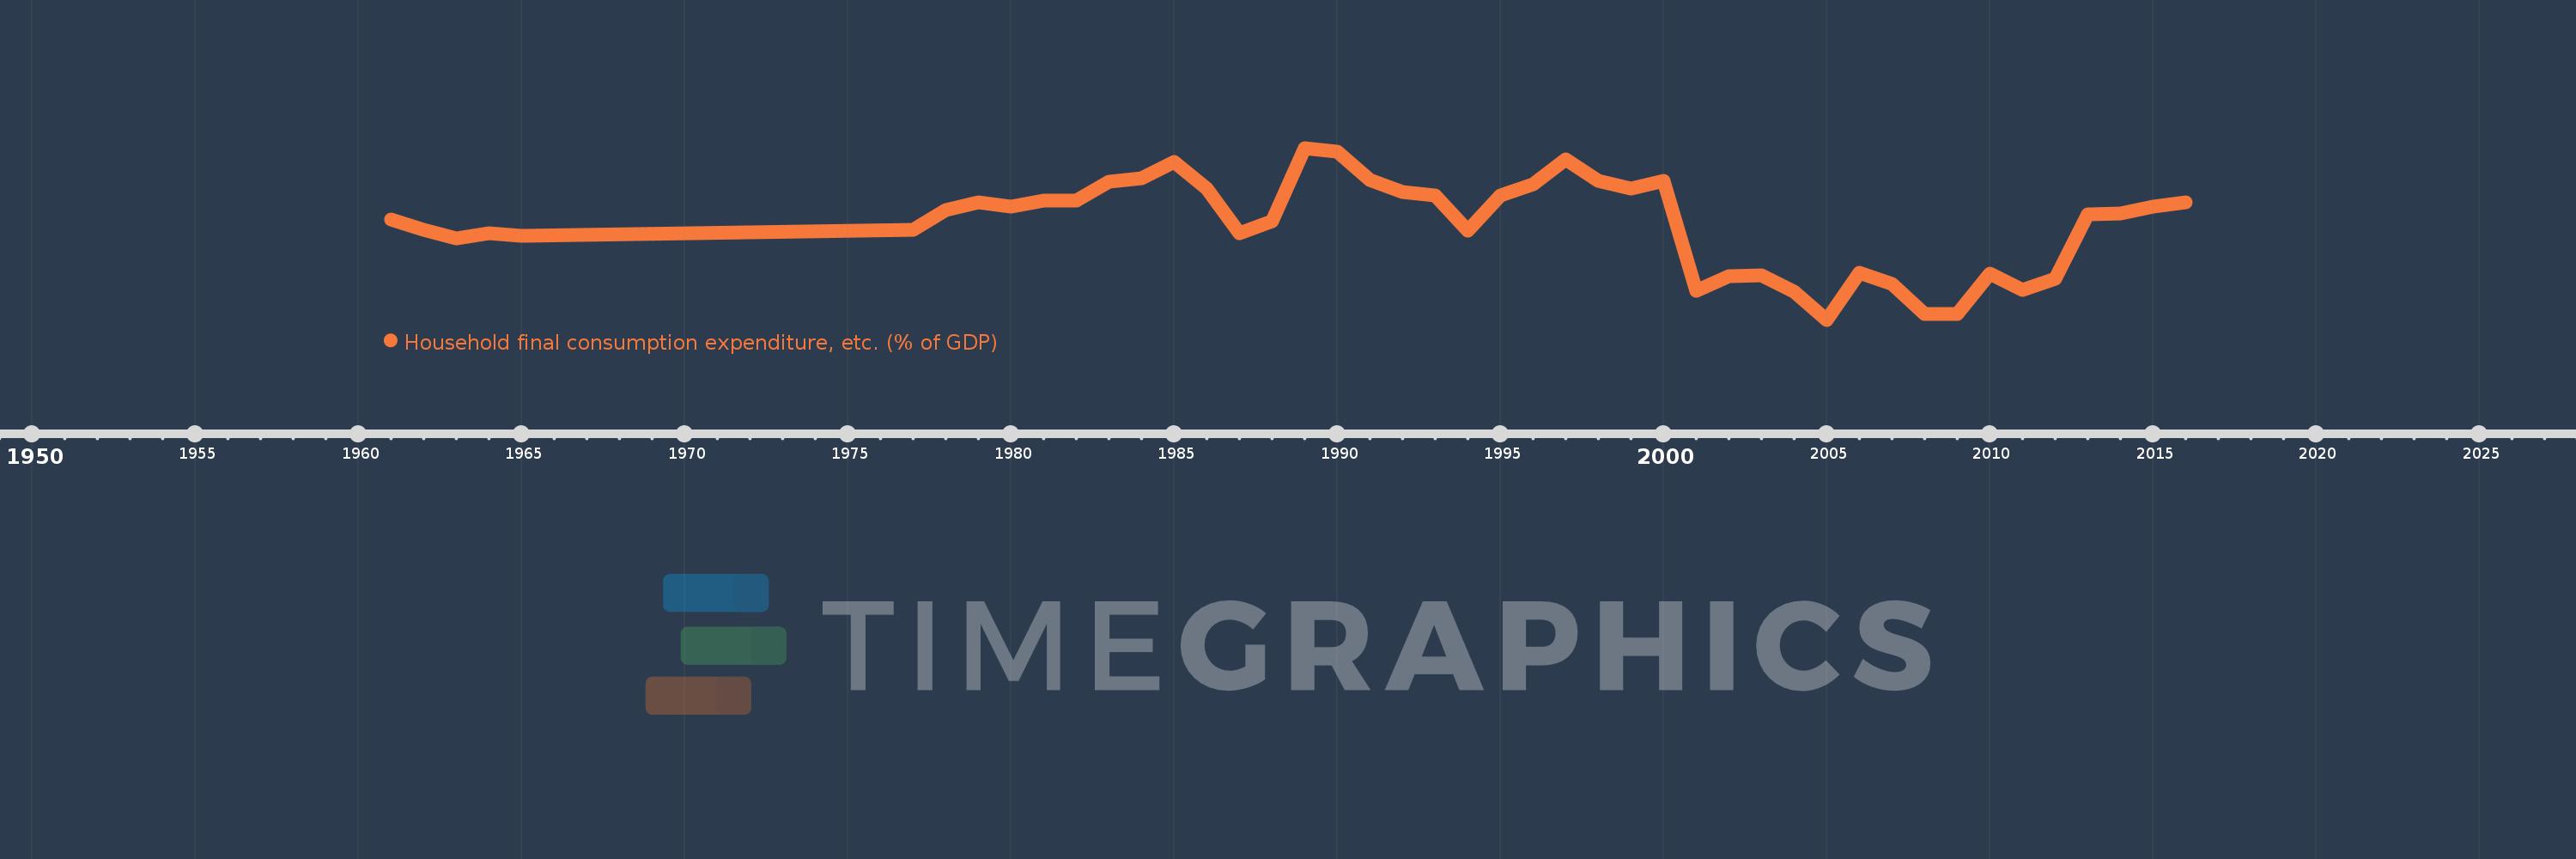
Household final consumption expenditure, etc. (% of GDP)
2016,2015,2014,2013,2012,2011,2010,2009,2008,2007,2006,2005,2004,2003,2002,2001,2000,1999,1998,1997,1996,1995,1994,1993,1992,1991,1990,1989,1988,1987,1986,1985,1984,1983,1982,1981,1980,1979,1978,1977,1965,1964,1963,1962,1961
Estas estatísticas em outros países:
AfghanistanAlbaniaAlgeriaAngolaAntigua and BarbudaArab WorldArgentinaArmeniaArubaAustraliaAustriaAzerbaijanBahamas, TheBahrainBangladeshBarbadosBelarusBelgiumBelizeBeninBermudaBhutanBoliviaBosnia and HerzegovinaBotswanaBrazilBrunei DarussalamBulgariaBurkina FasoBurundiCabo VerdeCambodiaCameroonCanadaCaribbean small statesCentral African RepublicCentral Europe and the BalticsChadChileChinaColombiaComorosCongo, Dem. Rep.Congo, Rep.Costa RicaCote d'IvoireCroatiaCubaCyprusCzech RepublicDenmarkDjiboutiDominicaDominican RepublicEarly-demographic dividendEast Asia & PacificEast Asia & Pacific (excluding high income)East Asia & Pacific (IDA & IBRD countries)EcuadorEgypt, Arab Rep.El SalvadorEquatorial GuineaEritreaEstoniaEthiopiaEuro areaEurope & Central AsiaEurope & Central Asia (excluding high income)Europe & Central Asia (IDA & IBRD countries)European UnionFaroe IslandsFijiFinlandFragile and conflict affected situationsFranceGabonGambia, TheGeorgiaGermanyGhanaGreeceGrenadaGuatemalaGuineaGuinea-BissauGuyanaHaitiHeavily indebted poor countries (HIPC)High incomeHondurasHong Kong SAR, ChinaHungaryIBRD onlyIcelandIDA & IBRD totalIDA blendIDA onlyIDA totalIndiaIndonesiaIran, Islamic Rep.IraqIrelandIsraelItalyJamaicaJapanJordanKazakhstanKenyaKiribatiKorea, Rep.KosovoKuwaitKyrgyz RepublicLao PDRLate-demographic dividendLatin America & Caribbean Latin America & Caribbean (excluding high income)Latin America & the Caribbean (IDA & IBRD countries)LatviaLeast developed countries: UN classificationLebanonLesothoLiberiaLibyaLithuaniaLow & middle incomeLow incomeLower middle incomeLuxembourgMacao SAR, ChinaMacedonia, FYRMadagascarMalawiMalaysiaMaldivesMaliMaltaMauritaniaMauritiusMexicoMicronesia, Fed. Sts.Middle East & North AfricaMiddle East & North Africa (excluding high income)Middle East & North Africa (IDA & IBRD countries)Middle incomeMoldovaMongoliaMontenegroMoroccoMozambiqueNamibiaNepalNetherlandsNew CaledoniaNew ZealandNicaraguaNigerNigeriaNorth AmericaNorwayOECD membersOmanOther small statesPacific island small statesPakistanPanamaPapua New GuineaParaguayPeruPhilippinesPolandPortugalPost-demographic dividendPre-demographic dividendPuerto RicoQatarRomaniaRussian FederationRwandaSaudi ArabiaSenegalSerbiaSeychellesSierra LeoneSingaporeSlovak RepublicSloveniaSmall statesSolomon IslandsSomaliaSouth AfricaSouth AsiaSouth Asia (IDA & IBRD)South SudanSpainSri LankaSt. Kitts and NevisSt. LuciaSt. Vincent and the GrenadinesSub-Saharan Africa Sub-Saharan Africa (excluding high income)Sub-Saharan Africa (IDA & IBRD countries)SudanSurinameSwazilandSwedenSwitzerlandSyrian Arab RepublicTajikistanTanzaniaThailandTimor-LesteTogoTongaTrinidad and TobagoTunisiaTurkeyTurkmenistanUgandaUkraineUnited Arab EmiratesUnited KingdomUnited StatesUpper middle incomeUruguayUzbekistanVanuatuVenezuela, RBVietnamWest Bank and GazaWorldYemen, Rep.ZambiaZimbabwe Linha do tempo:
Nesta escala de tempo está apresentado um gráfico de 1961 ano até 2016 ano Sudan. Dados de 1960 ano ausente. O número de observações reais por data: 45.
Fonte (nome):
Indicadores de desenvolvimento mundial
Fonte (organização):
World Bank national accounts data, and OECD National Accounts data files.
Categorias:
Economy & Growth
Foi atualizado:
23 abr 2017 ano
Indicadores de alterações dos valores ao longo dos anos
Mínimo:
57.641
1 jan 2005 ano
Máximo:
92.61
1 jan 1989 ano
Na data de observação
Valor
Mudança absoluta
A alteração em relação ao valor anterior
1 jan 1961 ano
78.047
+78.047
0.0%
1 jan 1962 ano
75.951
-2.096
-2.69%
1 jan 1963 ano
74.141
-1.811
-2.38%
1 jan 1964 ano
75.324
+1.184
1.6%
1 jan 1965 ano
74.741
-0.583
-0.77%
1 jan 1977 ano
76.029
+1.288
1.72%
1 jan 1978 ano
80.017
+3.988
5.24%
1 jan 1979 ano
81.497
+1.48
1.85%
1 jan 1980 ano
80.725
-0.773
-0.95%
1 jan 1981 ano
81.934
+1.21
1.5%
1 jan 1982 ano
81.81
-0.124
-0.15%
1 jan 1983 ano
85.77
+3.96
4.84%
1 jan 1984 ano
86.411
+0.642
0.75%
1 jan 1985 ano
89.817
+3.406
3.94%
1 jan 1986 ano
84.299
-5.518
-6.14%
1 jan 1987 ano
75.308
-8.992
-10.67%
1 jan 1988 ano
77.76
+2.453
3.26%
1 jan 1989 ano
92.61
+14.849
19.1%
1 jan 1990 ano
91.857
-0.752
-0.81%
1 jan 1991 ano
86.068
-5.789
-6.3%
1 jan 1992 ano
83.6
-2.468
-2.87%
1 jan 1993 ano
82.862
-0.738
-0.88%
1 jan 1994 ano
75.706
-7.156
-8.64%
1 jan 1995 ano
83.004
+7.298
9.64%
1 jan 1996 ano
85.216
+2.212
2.66%
1 jan 1997 ano
90.265
+5.049
5.93%
1 jan 1998 ano
85.984
-4.281
-4.74%
1 jan 1999 ano
84.297
-1.687
-1.96%
1 jan 2000 ano
85.866
+1.569
1.86%
1 jan 2001 ano
63.469
-22.397
-26.08%
1 jan 2002 ano
66.55
+3.081
4.85%
1 jan 2003 ano
66.612
+0.062
0.09%
1 jan 2004 ano
63.345
-3.267
-4.9%
1 jan 2005 ano
57.641
-5.704
-9.0%
1 jan 2006 ano
67.29
+9.648
16.74%
1 jan 2007 ano
64.871
-2.419
-3.59%
1 jan 2008 ano
58.752
-6.119
-9.43%
1 jan 2009 ano
58.868
+0.116
0.2%
1 jan 2010 ano
67.052
+8.185
13.9%
1 jan 2011 ano
63.765
-3.288
-4.9%
1 jan 2012 ano
66.068
+2.303
3.61%
1 jan 2013 ano
79.103
+13.035
19.73%
1 jan 2014 ano
79.281
+0.178
0.22%
1 jan 2015 ano
80.672
+1.391
1.75%
1 jan 2016 ano
81.597
+0.925
1.15%
Classificação de países por estatísticas atuais por anos


Comentários: