29
/pt/
pt
AIzaSyAYiBZKx7MnpbEhh9jyipgxe19OcubqV5w
April 1, 2024
100698
Cameroon
CMR
true
2
1
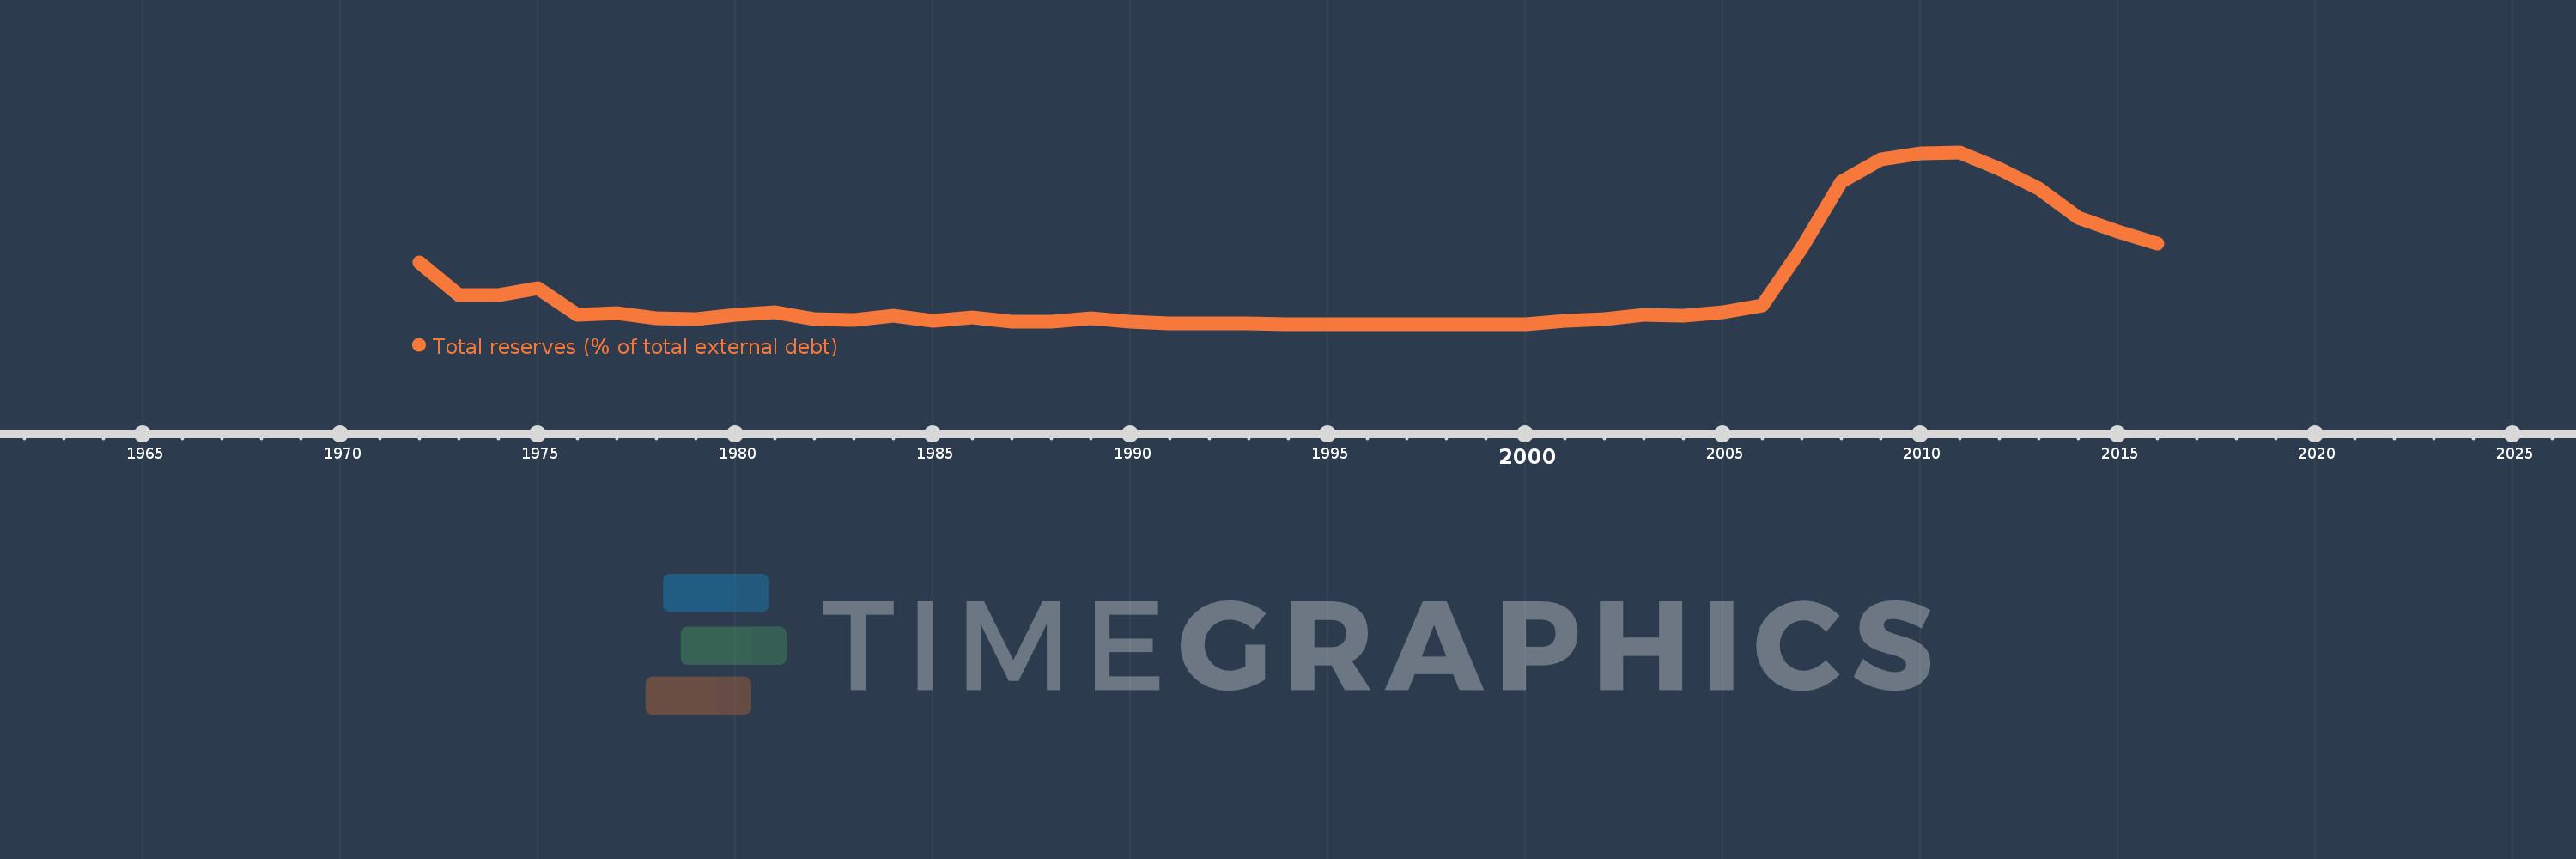
Total reserves (% of total external debt)
2016,2015,2014,2013,2012,2011,2010,2009,2008,2007,2006,2005,2004,2003,2002,2001,2000,1999,1998,1997,1996,1995,1994,1993,1992,1991,1990,1989,1988,1987,1986,1985,1984,1983,1982,1981,1980,1979,1978,1977,1976,1975,1974,1973,1972
Estas estatísticas em outros países:
Linha do tempo:
Nesta escala de tempo está apresentado um gráfico de 1972 ano até 2016 ano Cameroon. Dados de 1971 ano ausente. O número de observações reais por data: 45.
Fonte (nome):
Indicadores de desenvolvimento mundial
Fonte (organização):
World Bank, International Debt Statistics.
Categorias:
Financial Sector, External Debt
Foi atualizado:
23 abr 2017 ano
Indicadores de alterações dos valores ao longo dos anos
Mínimo:
0.088
1 jan 1999 ano
Máximo:
114.155
1 jan 2011 ano
Na data de observação
Valor
Mudança absoluta
A alteração em relação ao valor anterior
1 jan 1972 ano
40.867
+40.867
0.0%
1 jan 1973 ano
19.695
-21.172
-51.81%
1 jan 1974 ano
19.238
-0.458
-2.32%
1 jan 1975 ano
24.269
+5.031
26.15%
1 jan 1976 ano
6.531
-17.738
-73.09%
1 jan 1977 ano
7.17
+0.639
9.79%
1 jan 1978 ano
4.031
-3.139
-43.78%
1 jan 1979 ano
3.641
-0.39
-9.68%
1 jan 1980 ano
6.487
+2.846
78.18%
1 jan 1981 ano
8.021
+1.534
23.64%
1 jan 1982 ano
3.665
-4.356
-54.31%
1 jan 1983 ano
2.883
-0.783
-21.35%
1 jan 1984 ano
5.885
+3.003
104.17%
1 jan 1985 ano
2.179
-3.706
-62.98%
1 jan 1986 ano
4.5
+2.321
106.53%
1 jan 1987 ano
1.71
-2.79
-62.0%
1 jan 1988 ano
1.706
-0.004
-0.22%
1 jan 1989 ano
3.91
+2.203
129.15%
1 jan 1990 ano
1.713
-2.197
-56.19%
1 jan 1991 ano
0.565
-1.148
-67.02%
1 jan 1992 ano
0.792
+0.228
40.27%
1 jan 1993 ano
0.404
-0.389
-49.03%
1 jan 1994 ano
0.183
-0.221
-54.76%
1 jan 1995 ano
0.147
-0.036
-19.64%
1 jan 1996 ano
0.14
-0.006
-4.42%
1 jan 1997 ano
0.125
-0.015
-10.99%
1 jan 1998 ano
0.089
-0.036
-28.85%
1 jan 1999 ano
0.088
-0.001
-1.46%
1 jan 2000 ano
0.122
+0.034
39.18%
1 jan 2001 ano
2.085
+1.963
1.61 mil%
1 jan 2002 ano
3.489
+1.404
67.31%
1 jan 2003 ano
6.221
+2.733
78.33%
1 jan 2004 ano
5.716
-0.505
-8.12%
1 jan 2005 ano
7.76
+2.044
35.75%
1 jan 2006 ano
12.529
+4.769
61.45%
1 jan 2007 ano
50.76
+38.231
305.14%
1 jan 2008 ano
94.932
+44.172
87.02%
1 jan 2009 ano
109.669
+14.737
15.52%
1 jan 2010 ano
113.433
+3.763
3.43%
1 jan 2011 ano
114.155
+0.723
0.64%
1 jan 2012 ano
103.354
-10.801
-9.46%
1 jan 2013 ano
90.407
-12.947
-12.53%
1 jan 2014 ano
70.635
-19.772
-21.87%
1 jan 2015 ano
61.373
-9.262
-13.11%
1 jan 2016 ano
53.924
-7.448
-12.14%
Classificação de países por estatísticas atuais por anos


Comentários: