29
/pt/
pt
AIzaSyAYiBZKx7MnpbEhh9jyipgxe19OcubqV5w
April 1, 2024
202393
Morocco
MAR
true
2
1
Total reserves (% of total external debt)
2016,2015,2014,2013,2012,2011,2010,2009,2008,2007,2006,2005,2004,2003,2002,2001,2000,1999,1998,1997,1996,1995,1994,1993,1992,1991,1990,1989,1988,1987,1986,1985,1984,1983,1982,1981,1980,1979,1978,1977,1976,1975,1974,1973,1972
Estas estatísticas em outros países:
Linha do tempo:
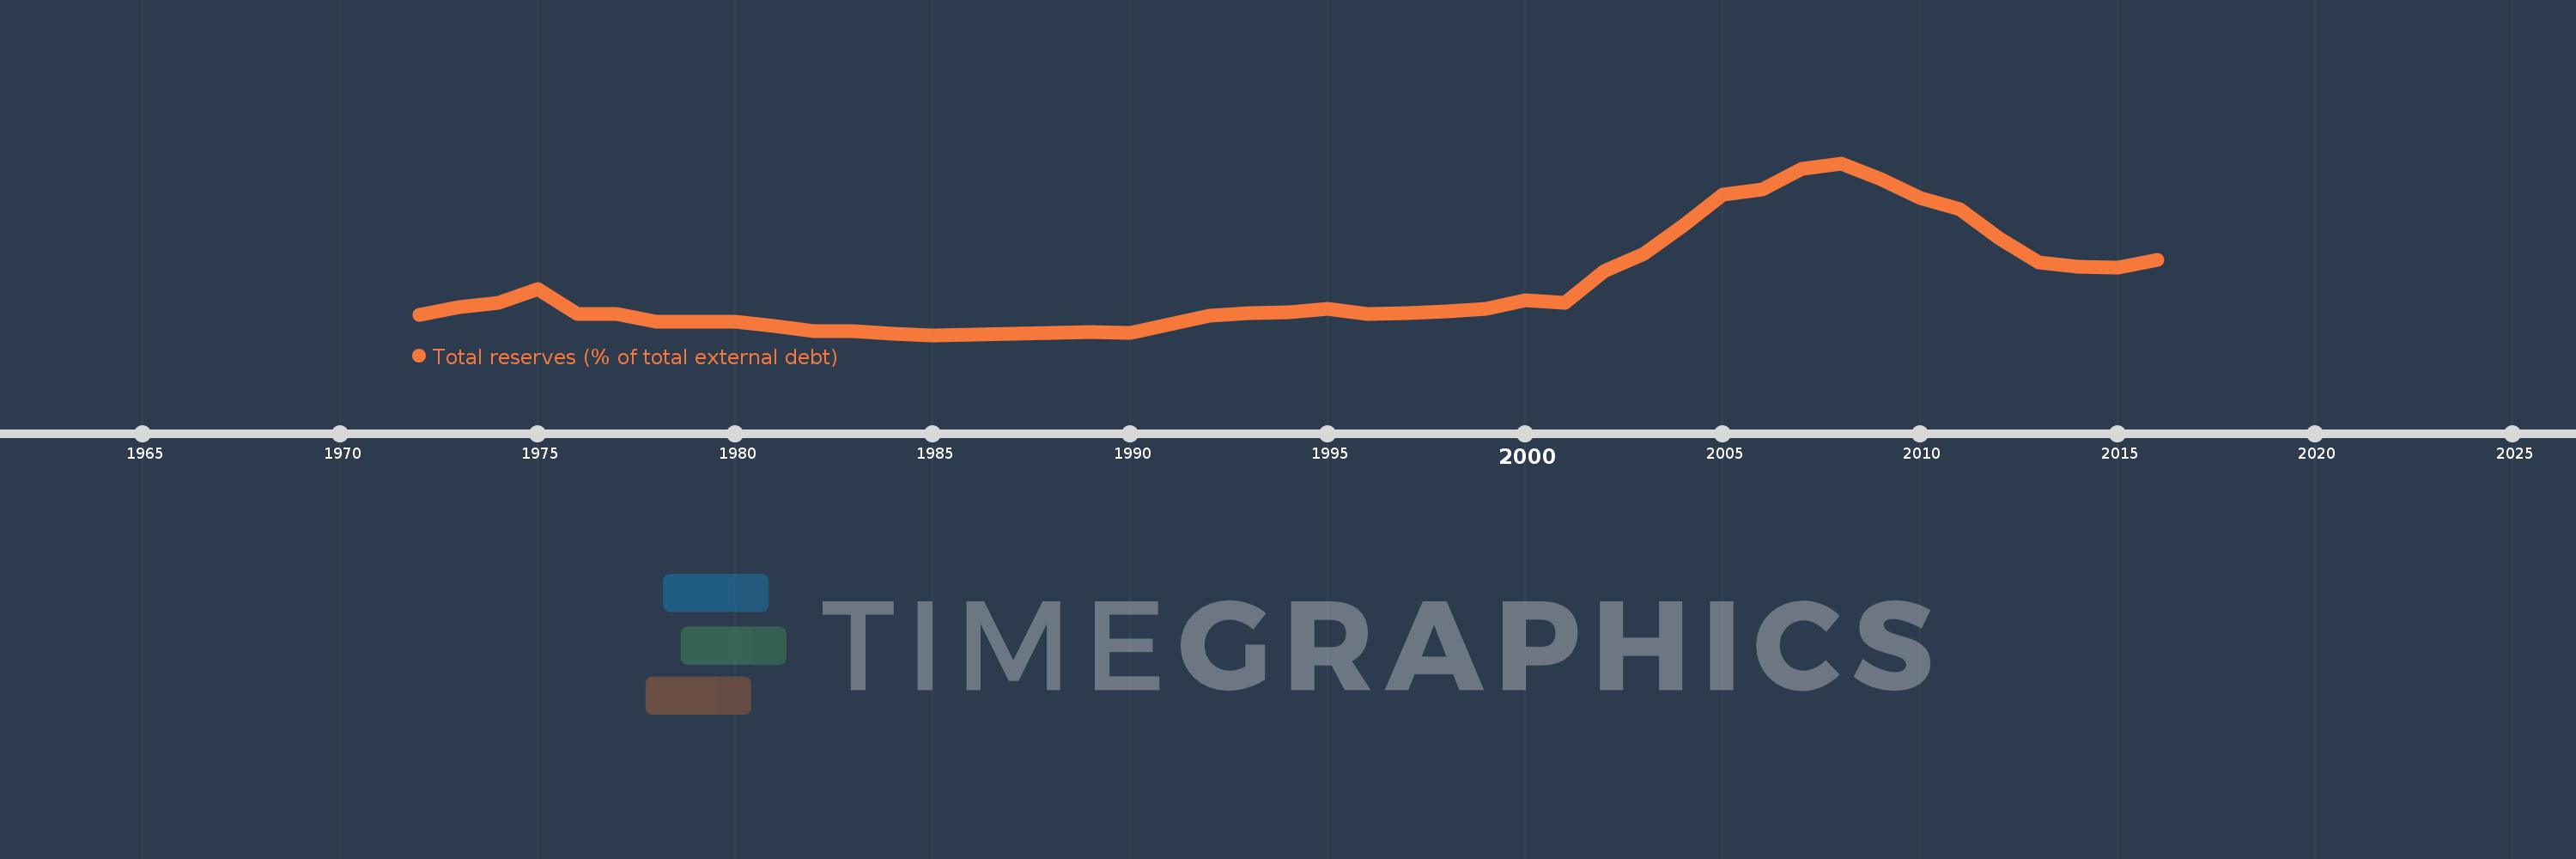
Nesta escala de tempo está apresentado um gráfico de 1972 ano até 2016 ano Morocco. Dados de 1971 ano ausente. O número de observações reais por data: 45.
Fonte (nome):
Indicadores de desenvolvimento mundial
Fonte (organização):
World Bank, International Debt Statistics.
Categorias:
Financial Sector, External Debt
Foi atualizado:
23 abr 2017 ano
Indicadores de alterações dos valores ao longo dos anos
Mínimo:
1.911
1 jan 1985 ano
Máximo:
119.509
1 jan 2008 ano
Na data de observação
Valor
Mudança absoluta
A alteração em relação ao valor anterior
1 jan 1972 ano
15.678
+15.678
0.0%
1 jan 1973 ano
21.297
+5.618
35.84%
1 jan 1974 ano
23.912
+2.615
12.28%
1 jan 1975 ano
33.308
+9.396
39.29%
1 jan 1976 ano
16.456
-16.852
-50.59%
1 jan 1977 ano
16.335
-0.121
-0.73%
1 jan 1978 ano
10.865
-5.47
-33.49%
1 jan 1979 ano
11.152
+0.287
2.64%
1 jan 1980 ano
11.178
+0.026
0.23%
1 jan 1981 ano
8.369
-2.809
-25.13%
1 jan 1982 ano
4.816
-3.553
-42.45%
1 jan 1983 ano
4.348
-0.468
-9.71%
1 jan 1984 ano
2.878
-1.47
-33.81%
1 jan 1985 ano
1.911
-0.968
-33.62%
1 jan 1986 ano
2.151
+0.24
12.56%
1 jan 1987 ano
2.714
+0.564
26.21%
1 jan 1988 ano
3.576
+0.862
31.74%
1 jan 1989 ano
3.96
+0.385
10.75%
1 jan 1990 ano
3.467
-0.493
-12.45%
1 jan 1991 ano
9.34
+5.873
169.38%
1 jan 1992 ano
14.883
+5.543
59.34%
1 jan 1993 ano
16.831
+1.948
13.09%
1 jan 1994 ano
17.77
+0.939
5.58%
1 jan 1995 ano
20.104
+2.334
13.13%
1 jan 1996 ano
16.286
-3.818
-18.99%
1 jan 1997 ano
16.729
+0.444
2.73%
1 jan 1998 ano
17.859
+1.129
6.75%
1 jan 1999 ano
19.604
+1.745
9.77%
1 jan 2000 ano
25.559
+5.955
30.38%
1 jan 2001 ano
24.131
-1.428
-5.59%
1 jan 2002 ano
45.866
+21.735
90.07%
1 jan 2003 ano
57.311
+11.445
24.95%
1 jan 2004 ano
77.169
+19.858
34.65%
1 jan 2005 ano
97.825
+20.655
26.77%
1 jan 2006 ano
101.828
+4.003
4.09%
1 jan 2007 ano
115.86
+14.032
13.78%
1 jan 2008 ano
119.509
+3.649
3.15%
1 jan 2009 ano
108.411
-11.098
-9.29%
1 jan 2010 ano
95.544
-12.867
-11.87%
1 jan 2011 ano
87.883
-7.661
-8.02%
1 jan 2012 ano
68.234
-19.65
-22.36%
1 jan 2013 ano
51.397
-16.837
-24.68%
1 jan 2014 ano
48.521
-2.875
-5.59%
1 jan 2015 ano
47.949
-0.573
-1.18%
1 jan 2016 ano
53.515
+5.566
11.61%
Classificação de países por estatísticas atuais por anos


Comentários: