29
/pt/
pt
AIzaSyAYiBZKx7MnpbEhh9jyipgxe19OcubqV5w
April 1, 2024
220321
Papua New Guinea
PNG
true
2
1
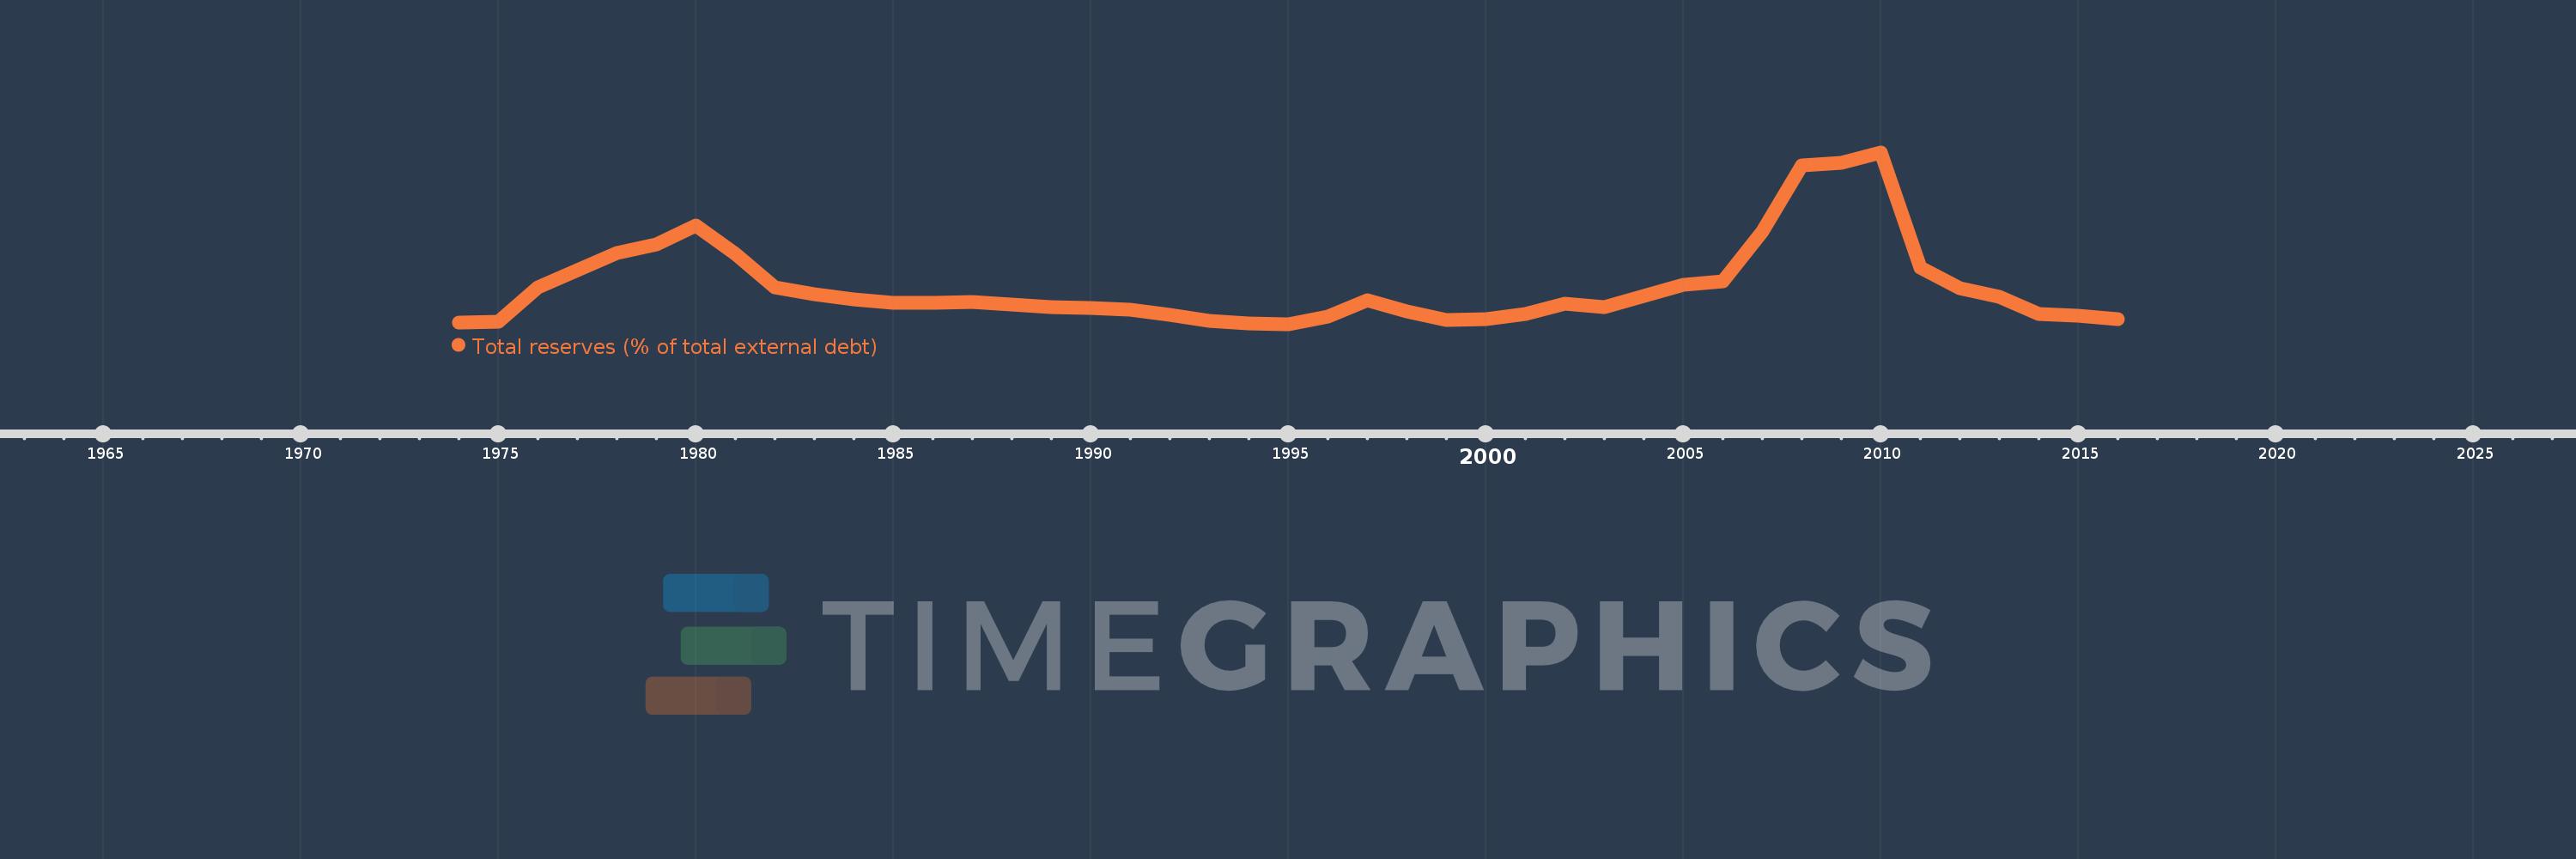
Total reserves (% of total external debt)
2016,2015,2014,2013,2012,2011,2010,2009,2008,2007,2006,2005,2004,2003,2002,2001,2000,1999,1998,1997,1996,1995,1994,1993,1992,1991,1990,1989,1988,1987,1986,1985,1984,1983,1982,1981,1980,1979,1978,1977,1976,1975,1974
Estas estatísticas em outros países:
Linha do tempo:
Nesta escala de tempo está apresentado um gráfico de 1974 ano até 2016 ano Papua New Guinea. Dados de 1973 ano ausente. O número de observações reais por data: 43.
Fonte (nome):
Indicadores de desenvolvimento mundial
Fonte (organização):
World Bank, International Debt Statistics.
Categorias:
Financial Sector, External Debt
Foi atualizado:
23 abr 2017 ano
Indicadores de alterações dos valores ao longo dos anos
Mínimo:
4.305
1 jan 1995 ano
Máximo:
148.623
1 jan 2010 ano
Na data de observação
Valor
Mudança absoluta
A alteração em relação ao valor anterior
1 jan 1974 ano
5.948
+5.948
0.0%
1 jan 1975 ano
6.422
+0.474
7.97%
1 jan 1976 ano
35.505
+29.084
452.9%
1 jan 1977 ano
49.391
+13.885
39.11%
1 jan 1978 ano
63.829
+14.439
29.23%
1 jan 1979 ano
71.106
+7.277
11.4%
1 jan 1980 ano
87.212
+16.105
22.65%
1 jan 1981 ano
63.667
-23.545
-27.0%
1 jan 1982 ano
35.532
-28.135
-44.19%
1 jan 1983 ano
29.576
-5.956
-16.76%
1 jan 1984 ano
24.842
-4.734
-16.01%
1 jan 1985 ano
22.402
-2.44
-9.82%
1 jan 1986 ano
21.927
-0.474
-2.12%
1 jan 1987 ano
22.684
+0.757
3.45%
1 jan 1988 ano
20.535
-2.149
-9.48%
1 jan 1989 ano
18.639
-1.896
-9.23%
1 jan 1990 ano
17.686
-0.953
-5.11%
1 jan 1991 ano
16.473
-1.213
-6.86%
1 jan 1992 ano
12.448
-4.025
-24.43%
1 jan 1993 ano
6.851
-5.597
-44.96%
1 jan 1994 ano
5.081
-1.77
-25.84%
1 jan 1995 ano
4.305
-0.776
-15.27%
1 jan 1996 ano
10.644
+6.339
147.25%
1 jan 1997 ano
24.215
+13.571
127.5%
1 jan 1998 ano
14.712
-9.503
-39.25%
1 jan 1999 ano
7.78
-6.931
-47.11%
1 jan 2000 ano
8.408
+0.628
8.07%
1 jan 2001 ano
13.082
+4.673
55.58%
1 jan 2002 ano
21.494
+8.412
64.31%
1 jan 2003 ano
18.479
-3.015
-14.03%
1 jan 2004 ano
27.932
+9.453
51.15%
1 jan 2005 ano
37.302
+9.371
33.55%
1 jan 2006 ano
40.11
+2.808
7.53%
1 jan 2007 ano
82.113
+42.003
104.72%
1 jan 2008 ano
137.583
+55.471
67.55%
1 jan 2009 ano
139.81
+2.226
1.62%
1 jan 2010 ano
148.623
+8.813
6.3%
1 jan 2011 ano
52.133
-96.49
-64.92%
1 jan 2012 ano
34.59
-17.543
-33.65%
1 jan 2013 ano
27.041
-7.549
-21.82%
1 jan 2014 ano
13.191
-13.85
-51.22%
1 jan 2015 ano
11.403
-1.788
-13.56%
1 jan 2016 ano
8.779
-2.624
-23.01%
Classificação de países por estatísticas atuais por anos


Comentários: